Frontier Communications 2010 Annual Report Download - page 90
Download and view the complete annual report
Please find page 90 of the 2010 Frontier Communications annual report below. You can navigate through the pages in the report by either clicking on the pages listed below, or by using the keyword search tool below to find specific information within the annual report.-
 1
1 -
2
-
3
-
4
-
5
-
6
-
7
-
8
-
9
-
10
-
11
-
12
-
13
-
14
-
15
-
16
-
17
-
18
-
19
-
20
-
21
-
22
-
23
-
24
-
25
-
26
-
27
-
28
-
29
-
30
-
31
-
32
-
33
-
34
-
35
-
36
-
37
-
38
-
39
-
40
-
41
-
42
-
43
-
44
-
45
-
46
-
47
-
48
-
49
-
50
-
51
-
52
-
53
-
54
-
55
-
56
-
57
-
58
-
59
-
60
-
61
-
62
-
63
-
64
-
65
-
66
-
67
-
68
-
69
-
70
-
71
-
72
-
73
-
74
-
75
-
76
-
77
-
78
-
79
-
 80
80 -
 81
81 -
 82
82 -
 83
83 -
 84
84 -
 85
85 -
 86
86 -
 87
87 -
 88
88 -
 89
89 -
 90
90 -
 91
91 -
 92
92 -
 93
93 -
 94
94 -
 95
95 -
 96
96 -
 97
97 -
 98
98 -
 99
99 -
 100
100 -
101
-
102
-
103
-
104
 |
 |
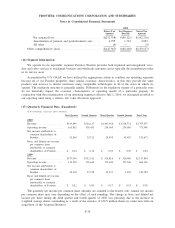
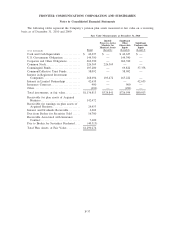
We recognized $10.4 million ($6.5 million or $0.02 per share after tax), $37.0 million ($23.1 million or
$0.08 per share after tax), $78.5 million ($49.1 million or $0.05 per share after tax), and $11.3 million ($7.0
million or $0.01 per share after tax) of acquisition and integration costs during the first, second, third and fourth
quarters of 2010, respectively.
We recognized $10.8 million ($6.8 million or $0.02 per share after tax), $3.7 million ($2.3 million or
$0.01 per share after tax) and $13.9 million ($8.8 million or $0.03 per share after tax) of acquisition and
integration costs during the second, third and fourth quarters of 2009, respectively. During the fourth quarter of
2009, we recognized a loss of $53.7 million ($33.8 million or $0.11 per share after tax) on the early retirement
of debt in connection with a $700.0 million debt tender offer.
(18) Retirement Plans:
We sponsor a noncontributory defined benefit pension plan covering a significant number of our former
and current employees and other postretirement benefit plans that provide medical, dental, life insurance and
other benefits for covered retired employees and their beneficiaries and covered dependents. The benefits are
based on years of service and final average pay or career average pay. Contributions are made in amounts
sufficient to meet ERISA funding requirements while considering tax deductibility. Plan assets are invested in a
diversified portfolio of equity and fixed-income securities and alternative investments.
The accounting results for pension and other postretirement benefit costs and obligations are dependent
upon various actuarial assumptions applied in the determination of such amounts. These actuarial assumptions
include the following: discount rates, expected long-term rate of return on plan assets, future compensation
increases, employee turnover, healthcare cost trend rates, expected retirement age, optional form of benefit and
mortality. We review these assumptions for changes annually with our independent actuaries. We consider our
discount rate and expected long-term rate of return on plan assets to be our most critical assumptions.
The discount rate is used to value, on a present value basis, our pension and other postretirement benefit
obligations as of the balance sheet date. The same rate is also used in the interest cost component of the
pension and postretirement benefit cost determination for the following year. The measurement date used in the
selection of our discount rate is the balance sheet date. Our discount rate assumption is determined annually
with assistance from our independent actuaries based on the pattern of expected future benefit payments and the
prevailing rates available on long-term, high quality corporate bonds that approximate the benefit obligation. In
making this determination we consider, among other things, the yields on the Citigroup Pension Discount
Curve, the Citigroup Above-Median Pension Curve, the Towers-Watson Index, the general movement of
interest rates and the changes in those rates from one period to the next. This rate can change from year-to-year
based on market conditions that affect corporate bond yields. Our discount rate was 5.25% at year-end 2010,
5.75% at year-end 2009 and 6.50% at year-end 2008.
The expected long-term rate of return on plan assets is applied in the determination of periodic pension
and postretirement benefit cost as a reduction in the computation of the expense. In developing the expected
long-term rate of return assumption, we considered published surveys of expected market returns, 10 and 20
year actual returns of various major indices, and our own historical 5-year, 10-year and 20-year investment
returns. The expected long-term rate of return on plan assets is based on an asset allocation assumption of 35%
to 55% in fixed income securities, 35% to 55% in equity securities and 5% to 15% in alternative investments.
We review our asset allocation at least annually and make changes when considered appropriate. Our pension
asset investment allocation decisions are made by the Retirement Investment & Administration Committee
(RIAC), a committee comprised of members of management, pursuant to a delegation of authority by the
Retirement Plan Committee of the Board of Directors. The RIAC is responsible for reporting its actions to the
Retirement Plan Committee. Asset allocation decisions take into account expected market return assumptions of
various asset classes as well as expected pension benefit payment streams. When analyzing anticipated benefit
payments, management considers both the absolute amount of the payments as well as the timing of such
payments. In 2010 and 2009, our expected long-term rate of return on plan assets was 8.00%, which was a
change from the 8.25% used in 2008. For 2011, we will assume a rate of return of 8.00%. Our pension plan
F-31
FRONTIER COMMUNICATIONS CORPORATION AND SUBSIDIARIES
Notes to Consolidated Financial Statements