Frontier Communications 2010 Annual Report Download - page 43
Download and view the complete annual report
Please find page 43 of the 2010 Frontier Communications annual report below. You can navigate through the pages in the report by either clicking on the pages listed below, or by using the keyword search tool below to find specific information within the annual report.-
 1
1 -
2
-
3
-
4
-
5
-
6
-
7
-
8
-
9
-
10
-
11
-
12
-
13
-
14
-
15
-
16
-
17
-
18
-
19
-
20
-
21
-
22
-
23
-
24
-
25
-
26
-
27
-
28
-
29
-
30
-
31
-
32
-
 33
33 -
 34
34 -
 35
35 -
 36
36 -
 37
37 -
 38
38 -
 39
39 -
 40
40 -
 41
41 -
 42
42 -
 43
43 -
 44
44 -
 45
45 -
 46
46 -
 47
47 -
 48
48 -
 49
49 -
 50
50 -
 51
51 -
 52
52 -
 53
53 -
54
-
55
-
56
-
57
-
58
-
59
-
60
-
61
-
62
-
63
-
64
-
65
-
66
-
67
-
68
-
69
-
70
-
71
-
72
-
73
-
74
-
75
-
76
-
77
-
78
-
79
-
80
-
81
-
82
-
83
-
84
-
85
-
86
-
87
-
88
-
89
-
90
-
91
-
92
-
93
-
94
-
95
-
96
-
97
-
98
-
99
-
100
-
101
-
102
-
103
-
104
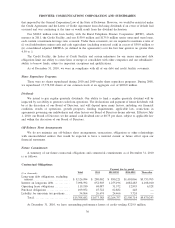
 |
 |

2010
$ Increase
(Decrease)
% Increase
(Decrease) 2009
$ Increase
(Decrease)
% Increase
(Decrease) 2008
For the year ended December 31,
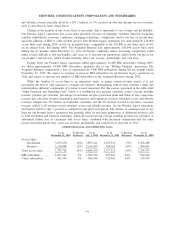
Revenue (in 000’s):
Residential . . . . . . . . . . . $1,678,551 $ 778,751 87% $ 899,800 $ (49,484) (5%) $ 949,284
Business . . . . . . . . . . . . . 1,621,349 762,889 89% 858,460 (24,561) (3%) 883,021
Total customer revenue . . . $3,299,900 $1,541,640 88% $1,758,260 $ (74,045) (4%) $1,832,305
Regulatory (switched
access and subsidy) . . . . . 497,775 138,141 38% 359,634 (45,079) (11%) 404,713
Total revenue . . . . . . . . . . . . . $3,797,675 $1,679,781 79% $2,117,894 $(119,124) (5%) $2,237,018
Switched access minutes
of use (in millions) . . . . . 14,542 64% 8,854 (12%) 10,027
Average monthly total
revenue per access line
—Frontier Legacy . . . . . . $ 83.20 3% $ 80.74 1% $ 79.62
Average monthly customer
revenue per access line
—Frontier Legacy . . . . . . $ 69.89 4% $ 67.03 3% $ 65.22
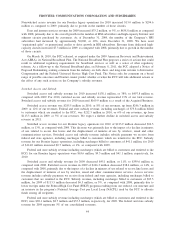
As of or for the
year ended
December 31, 2010
% Increase
(Decrease)
As of or for the
year ended
December 31, 2009
% Increase
(Decrease)
As of or for the
year ended
December 31, 2008
Residential Customer Metrics:
Customers. . . . . . . . . . . . . . . . . . . 3,445,193 175% 1,254,508 (7%) 1,347,423
Revenue (in 000’s) . . . . . . . . . . $1,678,551 87% $ 899,800 (5%) $ 949,284
Products per Residential
Customer(1)
—Frontier Legacy . . . . . . . . . 2.60 3% 2.52 6% 2.37
Average monthly residential
revenue per customer
—Frontier Legacy . . . . . . . . . $ 60.31 5% $ 57.62 2% $ 56.42
Percent of Customers on
Price Protection Plans
—Frontier Legacy . . . . . . . . . 58.4% 10% 53.3% 20% 44.6%
Customer Monthly Churn
—Frontier Legacy . . . . . . . . . 1.33% (10%) 1.47% (6%) 1.57%
Business Customer Metrics:
Customers. . . . . . . . . . . . . . . . . . . 343,823 144% 140,763
Revenue (in 000’s) . . . . . . . . . . $1,621,349 89% $ 858,460
Average monthly business
revenue per customer
—Frontier Legacy . . . . . . . . . $ 511.33 5% $ 485.72
(1) Products per residential customer: primary residential voice line, HSI and video products have a value of 1.
Long distance, Frontier Peace of Mind, second lines, feature packages and dial-up have a value of 0.5.
42
FRONTIER COMMUNICATIONS CORPORATION AND SUBSIDIARIES