Frontier Communications 2010 Annual Report Download - page 9
Download and view the complete annual report
Please find page 9 of the 2010 Frontier Communications annual report below. You can navigate through the pages in the report by either clicking on the pages listed below, or by using the keyword search tool below to find specific information within the annual report.-
 1
1 -
 2
2 -
 3
3 -
 4
4 -
 5
5 -
 6
6 -
 7
7 -
 8
8 -
 9
9 -
 10
10 -
 11
11 -
 12
12 -
 13
13 -
 14
14 -
 15
15 -
 16
16 -
 17
17 -
 18
18 -
 19
19 -
 20
20 -
21
-
22
-
23
-
24
-
25
-
26
-
27
-
28
-
29
-
30
-
31
-
32
-
33
-
34
-
35
-
36
-
37
-
38
-
39
-
40
-
41
-
42
-
43
-
44
-
45
-
46
-
47
-
48
-
49
-
50
-
51
-
52
-
53
-
54
-
55
-
56
-
57
-
58
-
59
-
60
-
61
-
62
-
63
-
64
-
65
-
66
-
67
-
68
-
69
-
70
-
71
-
72
-
73
-
74
-
75
-
76
-
77
-
78
-
79
-
80
-
81
-
82
-
83
-
84
-
85
-
86
-
87
-
88
-
89
-
90
-
91
-
92
-
93
-
94
-
95
-
96
-
97
-
98
-
99
-
100
-
101
-
102
-
103
-
104
 |
 |

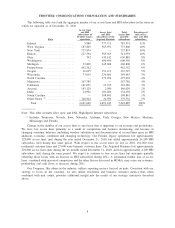
The following table sets forth the aggregate number of our access lines and HSI subscribers in the states in
which we operated as of December 31, 2010.
State
Access lines
and HSI
subscribers of
Frontier legacy
operations
Access lines
and HSI
subscribers of the
Acquired Business
Total
Access lines
and HSI
subscribers
Percentage of
total access
lines and HSI
subscribers
Indiana. . . . . . . . . . . . . . . . . . . . . . . . . . . . . . 5,880 777,711 783,591 11%
West Virginia . . . . . . . . . . . . . . . . . . . . . . . 187,849 585,951 773,800 10%
New York. . . . . . . . . . . . . . . . . . . . . . . . . . . 737,874 — 737,874 10%
Illinois . . . . . . . . . . . . . . . . . . . . . . . . . . . . . . 127,594 585,365 712,959 10%
Ohio................................ 742 630,142 630,884 8%
Washington ......................... —600,450 600,450 8%
Michigan. . . . . . . . . . . . . . . . . . . . . . . . . . . . 23,800 445,008 468,808 6%
Pennsylvania . . . . . . . . . . . . . . . . . . . . . . . . 462,362 — 462,362 6%
Oregon. . . . . . . . . . . . . . . . . . . . . . . . . . . . . . 16,615 351,112 367,727 5%
Wisconsin . . . . . . . . . . . . . . . . . . . . . . . . . . . 73,019 276,664 349,683 5%
North Carolina ...................... —275,976 275,976 4%
Minnesota . . . . . . . . . . . . . . . . . . . . . . . . . . . 267,789 — 267,789 4%
California . . . . . . . . . . . . . . . . . . . . . . . . . . . 181,051 21,335 202,386 3%
Arizona . . . . . . . . . . . . . . . . . . . . . . . . . . . . . 183,129 2,900 186,029 2%
Idaho . . . . . . . . . . . . . . . . . . . . . . . . . . . . . . . 24,992 109,200 134,192 2%
South Carolina ...................... —108,841 108,841 1%
Other States (1) ...................... 348,944 30,590 379,534 5%
Total . . . . . . . . . . . . . . . . . . . . . . . . . . . . . 2,641,640 4,801,245 7,442,885 100%
Note: This table includes fiber optic and DSL High-Speed Internet subscribers.
(1) Includes Tennessee, Nevada, Iowa, Nebraska, Alabama, Utah, Georgia, New Mexico, Montana,
Mississippi and Florida.
Change in the number of our access lines is one factor that is important to our revenue and profitability.
We have lost access lines primarily as a result of competition and business downsizing, and because of
changing consumer behavior (including wireless substitution and disconnections of second lines upon an HSI
addition), economic conditions and changing technology. Our Frontier legacy operations lost approximately
128,000 access lines (net) during the year ended December 31, 2010, but added approximately 16,200 HSI
subscribers (net) during this same period. With respect to the access lines we lost in 2010, 101,000 were
residential customer lines and 27,000 were business customer lines. The Acquired Business lost approximately
201,000 access lines (net) during the six months ended December 31, 2010, and lost approximately 4,100 HSI
subscribers (net) during the same period. We expect to continue to lose access lines but anticipate partially
offsetting those losses with an increase in HSI subscribers during 2011. A substantial further loss of access
lines, combined with increased competition and the other factors discussed in MD&A, may cause our revenues,
profitability and cash flows to decrease during 2011.
Our Company, like others in the industry, utilizes reporting metrics focused on units. Consistent with our
strategy to focus on the customer, we also utilize residential and business customer metrics that, when
combined with unit counts, provides additional insight into the results of our strategic initiatives described
above.
8
FRONTIER COMMUNICATIONS CORPORATION AND SUBSIDIARIES