Frontier Communications 2010 Annual Report Download - page 68
Download and view the complete annual report
Please find page 68 of the 2010 Frontier Communications annual report below. You can navigate through the pages in the report by either clicking on the pages listed below, or by using the keyword search tool below to find specific information within the annual report.-
 1
1 -
2
-
3
-
4
-
5
-
6
-
7
-
8
-
9
-
10
-
11
-
12
-
13
-
14
-
15
-
16
-
17
-
18
-
19
-
20
-
21
-
22
-
23
-
24
-
25
-
26
-
27
-
28
-
29
-
30
-
31
-
32
-
33
-
34
-
35
-
36
-
37
-
38
-
39
-
40
-
41
-
42
-
43
-
44
-
45
-
46
-
47
-
48
-
49
-
50
-
51
-
52
-
53
-
54
-
55
-
56
-
57
-
 58
58 -
 59
59 -
 60
60 -
 61
61 -
 62
62 -
 63
63 -
 64
64 -
 65
65 -
 66
66 -
 67
67 -
 68
68 -
 69
69 -
 70
70 -
 71
71 -
 72
72 -
 73
73 -
 74
74 -
 75
75 -
 76
76 -
 77
77 -
 78
78 -
79
-
80
-
81
-
82
-
83
-
84
-
85
-
86
-
87
-
88
-
89
-
90
-
91
-
92
-
93
-
94
-
95
-
96
-
97
-
98
-
99
-
100
-
101
-
102
-
103
-
104
 |
 |

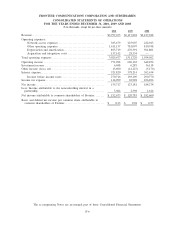
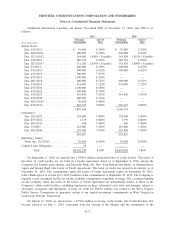
FRONTIER COMMUNICATIONS CORPORATION AND SUBSIDIARIES
CONSOLIDATED STATEMENTS OF CASH FLOWS
FOR THE YEARS ENDED DECEMBER 31, 2010, 2009 AND 2008
($ in thousands)
2010 2009 2008
Cash flows provided by (used in) operating activities:
Net income . . . . . . . . . . . . . . . . . . . . . . . . . . . . . . . . . . . . . . . . . . . . . . . . . . . . . . . . . . . . . . . . . . . . . . . $ 155,717 $ 123,181 $ 184,274
Adjustments to reconcile net income to net cash provided by operating activities:
Depreciation and amortization expense. . . . . . . . . . . . . . . . . . . . . . . . . . . . . . . . . . . . . . . . . 893,719 476,391 561,801
Stock based compensation expense . . . . . . . . . . . . . . . . . . . . . . . . . . . . . . . . . . . . . . . . . . . . 14,473 9,368 7,788
Pension/OPEB costs . . . . . . . . . . . . . . . . . . . . . . . . . . . . . . . . . . . . . . . . . . . . . . . . . . . . . . . . . . 40,050 34,196 163
Loss on extinguishment of debt, net . . . . . . . . . . . . . . . . . . . . . . . . . . . . . . . . . . . . . . . . . . . — 45,939 6,290
Other non-cash adjustments . . . . . . . . . . . . . . . . . . . . . . . . . . . . . . . . . . . . . . . . . . . . . . . . . . . 10,072 2,080 (8,658)
Deferred income taxes . . . . . . . . . . . . . . . . . . . . . . . . . . . . . . . . . . . . . . . . . . . . . . . . . . . . . . . . 85,432 61,217 33,967
Change in accounts receivable. . . . . . . . . . . . . . . . . . . . . . . . . . . . . . . . . . . . . . . . . . . . . . . . . (33,146) 21,906 9,746
Change in accounts payable and other liabilities. . . . . . . . . . . . . . . . . . . . . . . . . . . . . . . . 106,433 13,297 (52,210)
Change in prepaid expenses, income taxes and other current assets. . . . . . . . . . . . . . (50,570) (44,855) (3,895)
Net cash provided by operating activities . . . . . . . . . . . . . . . . . . . . . . . . . . . . . . . . . . . . . . . . . . . 1,222,180 742,720 739,266
Cash flows provided from (used by) investing activities:
Cash transferred to escrow . . . . . . . . . . . . . . . . . . . . . . . . . . . . . . . . . . . . . . . . . . . . . . . . . . . . (115,000) — —
Capital expenditures—Business operations . . . . . . . . . . . . . . . . . . . . . . . . . . . . . . . . . . . . . (480,888) (230,966) (288,264)
Capital expenditures—Integration activities. . . . . . . . . . . . . . . . . . . . . . . . . . . . . . . . . . . . . (96,991) (24,999) —
Cash paid for the Acquired Business (net of cash acquired) . . . . . . . . . . . . . . . . . . . . . (82,560) — —
Other assets purchased and distributions received, net . . . . . . . . . . . . . . . . . . . . . . . . . . 1,484 673 5,489
Net cash used by investing activities . . . . . . . . . . . . . . . . . . . . . . . . . . . . . . . . . . . . . . . . . . . . . . . (773,955) (255,292) (282,775)
Cash flows provided from (used by) financing activities:
Long-term debt borrowings. . . . . . . . . . . . . . . . . . . . . . . . . . . . . . . . . . . . . . . . . . . . . . . . . . . . — 1,117,476 135,000
Financing costs paid . . . . . . . . . . . . . . . . . . . . . . . . . . . . . . . . . . . . . . . . . . . . . . . . . . . . . . . . . . (12,868) (2,204) (857)
Long-term debt payments . . . . . . . . . . . . . . . . . . . . . . . . . . . . . . . . . . . . . . . . . . . . . . . . . . . . . (7,236) (1,027,408) (142,480)
Premium paid to retire debt . . . . . . . . . . . . . . . . . . . . . . . . . . . . . . . . . . . . . . . . . . . . . . . . . . . — (66,868) (6,290)
Settlement of interest rate swaps . . . . . . . . . . . . . . . . . . . . . . . . . . . . . . . . . . . . . . . . . . . . . . — — 15,521
Issuance of common stock . . . . . . . . . . . . . . . . . . . . . . . . . . . . . . . . . . . . . . . . . . . . . . . . . . . . — 751 1,398
Common stock repurchased . . . . . . . . . . . . . . . . . . . . . . . . . . . . . . . . . . . . . . . . . . . . . . . . . . . — — (200,000)
Dividends paid . . . . . . . . . . . . . . . . . . . . . . . . . . . . . . . . . . . . . . . . . . . . . . . . . . . . . . . . . . . . . . . (529,389) (312,366) (318,437)
Repayment of customer advances for construction and distributions to
noncontrolling interests . . . . . . . . . . . . . . . . . . . . . . . . . . . . . . . . . . . . . . . . . . . . . . . . . . . . . (6,162) (1,743) (3,185)
Net cash used by financing activities. . . . . . . . . . . . . . . . . . . . . . . . . . . . . . . . . . . . . . . . . . . . . . . (555,655) (292,362) (519,330)
(Decrease) increase in cash and cash equivalents. . . . . . . . . . . . . . . . . . . . . . . . . . . . . . . . . . . . (107,430) 195,066 (62,839)
Cash and cash equivalents at January 1, . . . . . . . . . . . . . . . . . . . . . . . . . . . . . . . . . . . . . . . . . . . . 358,693 163,627 226,466
Cash and cash equivalents at December 31, . . . . . . . . . . . . . . . . . . . . . . . . . . . . . . . . . . . . . . . . $ 251,263 $ 358,693 $ 163,627
Cash paid during the period for: . . . . . . . . . . . . . . . . . . . . . . . . . . . . . . . . . . . . . . . . . . . . . . . . . . .
Interest. . . . . . . . . . . . . . . . . . . . . . . . . . . . . . . . . . . . . . . . . . . . . . . . . . . . . . . . . . . . . . . . . . . . . . . $ 511,354 $ 364,167 $ 365,858
Income taxes . . . . . . . . . . . . . . . . . . . . . . . . . . . . . . . . . . . . . . . . . . . . . . . . . . . . . . . . . . . . . . . . . $ 19,885 $ 59,735 $ 78,878
Non-cash investing and financing activities:
Shares issued for acquisitions . . . . . . . . . . . . . . . . . . . . . . . . . . . . . . . . . . . . . . . . . . . . . . . . . $5,217,899 $ — $ 39
Assumed debt . . . . . . . . . . . . . . . . . . . . . . . . . . . . . . . . . . . . . . . . . . . . . . . . . . . . . . . . . . . . . . . . $3,456,782 $ — $ —
Other acquired liabilities . . . . . . . . . . . . . . . . . . . . . . . . . . . . . . . . . . . . . . . . . . . . . . . . . . . . . . $ 987,510 $ — $ —
Capital expenditures made with accounts payable. . . . . . . . . . . . . . . . . . . . . . . . . . . . . . . $ 43,978 $ — $ —
Change in fair value of interest rate swaps. . . . . . . . . . . . . . . . . . . . . . . . . . . . . . . . . . . . . $ — $ — $ 7,909
Conversion of EPPICS. . . . . . . . . . . . . . . . . . . . . . . . . . . . . . . . . . . . . . . . . . . . . . . . . . . . . . . . $ — $ — $ 590
Conversion of Commonwealth notes . . . . . . . . . . . . . . . . . . . . . . . . . . . . . . . . . . . . . . . . . . . $ — $ — $ 1,666
The accompanying Notes are an integral part of these Consolidated Financial Statements.
F-9