Frontier Communications 2010 Annual Report Download - page 30
Download and view the complete annual report
Please find page 30 of the 2010 Frontier Communications annual report below. You can navigate through the pages in the report by either clicking on the pages listed below, or by using the keyword search tool below to find specific information within the annual report.-
 1
1 -
2
-
3
-
4
-
5
-
6
-
7
-
8
-
9
-
10
-
11
-
12
-
13
-
14
-
15
-
16
-
17
-
18
-
19
-
 20
20 -
 21
21 -
 22
22 -
 23
23 -
 24
24 -
 25
25 -
 26
26 -
 27
27 -
 28
28 -
 29
29 -
 30
30 -
 31
31 -
 32
32 -
 33
33 -
 34
34 -
 35
35 -
 36
36 -
 37
37 -
 38
38 -
 39
39 -
 40
40 -
41
-
42
-
43
-
44
-
45
-
46
-
47
-
48
-
49
-
50
-
51
-
52
-
53
-
54
-
55
-
56
-
57
-
58
-
59
-
60
-
61
-
62
-
63
-
64
-
65
-
66
-
67
-
68
-
69
-
70
-
71
-
72
-
73
-
74
-
75
-
76
-
77
-
78
-
79
-
80
-
81
-
82
-
83
-
84
-
85
-
86
-
87
-
88
-
89
-
90
-
91
-
92
-
93
-
94
-
95
-
96
-
97
-
98
-
99
-
100
-
101
-
102
-
103
-
104
 |
 |

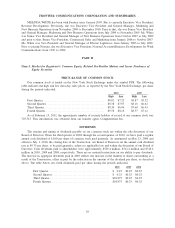
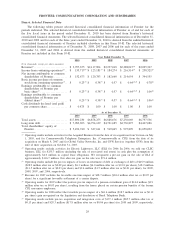
Item 6. Selected Financial Data
The following tables present selected historical consolidated financial information of Frontier for the
periods indicated. The selected historical consolidated financial information of Frontier as of and for each of
the five fiscal years in the period ended December 31, 2010 has been derived from Frontier’s historical
consolidated financial statements. The selected historical consolidated financial information as of December 31,
2010 and 2009 and for each of the three years ended December 31, 2010 is derived from the audited historical
consolidated financial statements of Frontier included elsewhere in this Form 10-K. The selected historical
consolidated financial information as of December 31, 2008, 2007 and 2006 and for each of the years ended
December 31, 2007 and 2006 is derived from the audited historical consolidated financial statements of
Frontier not included in this Form 10-K.
2010 2009 2008 2007 2006
Year Ended December 31,
($ in thousands, except per share amounts)
Revenue(1) .......................... $ 3,797,675 $2,117,894 $2,237,018 $2,288,015
(4) $2,025,367
Income from continuing operations(2) .. $ 155,717(7) $ 123,181(7) $ 184,274 $ 216,514(5) $ 258,321(6)
Net income attributable to common
shareholders of Frontier. . . . . . . . . . . $ 152,673 $ 120,783 $ 182,660 $ 214,654 $ 344,555
Basic income per share of common
stock from continuing operations(3).. $ 0.23(7) $ 0.38(7) $ 0.57 $ 0.64(4)(5) $ 0.78(6)
Earnings attributable to common
shareholders of Frontier per
basic share(3) ..................... $ 0.23
(7) $ 0.38(7) $ 0.57 $ 0.64(4)(5) $ 1.06(6)
Earnings attributable to common
shareholders of Frontier per
diluted share(3) ................... $ 0.23
(7) $ 0.38(7) $ 0.57 $ 0.64(4)(5) $ 1.06(6)
Cash dividends declared (and paid)
per common share. . . . . . . . . . . . . . . . $ 0.875 $ 1.00 $ 1.00 $ 1.00 $ 1.00
2010 2009 2008 2007 2006
As of December 31,
Total assets . . . . . . . . . . . . . . . . . . . . . . . . $17,890,230 $6,878,255 $6,888,676 $7,256,069 $6,797,536
Long-term debt . . . . . . . . . . . . . . . . . . . . . $ 7,983,693 $4,794,129 $4,721,685 $4,736,897 $4,467,086
Total shareholders’ equity of
Frontier . . . . . . . . . . . . . . . . . . . . . . . . . . $ 5,196,740 $ 327,611 $ 519,045 $ 997,899 $1,058,032
(1) Operating results include activities for the Acquired Business from the date of its acquisition from Verizon on July
1, 2010, and for Commonwealth Telephone Enterprises, Inc. (Commonwealth or CTE) from the date of its
acquisition on March 8, 2007 and for Global Valley Networks, Inc. and GVN Services (together GVN) from the
date of their acquisition on October 31, 2007.
(2) Operating results exclude activities for Electric Lightwave, LLC (ELI) for 2006. In 2006, we sold our CLEC
business, ELI, for $255.3 million (including the sale of associated real estate) in cash plus the assumption of
approximately $4.0 million in capital lease obligations. We recognized a pre-tax gain on the sale of ELI of
approximately $116.7 million. Our after-tax gain on the sale was $71.6 million.
(3) Operating results include the pre-tax impacts of losses on retirement of debt or exchanges of debt of $45.9 million
($28.9 million after tax or $0.09 per share), $6.3 million ($4.0 million after tax or $0.01 per share), $18.2 million
($11.5 million after tax or $0.03 per share) and $2.4 million ($1.5 million after tax or $0.01 per share), for 2009,
2008, 2007, and 2006, respectively.
(4) Revenue for 2007 includes the favorable one-time impact of $38.7 million ($24.4 million after tax or $0.07 per
share) for a significant favorable settlement of a carrier dispute.
(5) Operating results for 2007 reflect the positive pre-tax impact of a pension curtailment gain of $14.4 million ($9.1
million after tax or $0.03 per share), resulting from the freeze placed on certain pension benefits of the former
CTE non-union employees.
(6) Operating results for 2006 reflect the favorable pre-tax impact of a $61.4 million ($38.7 million after tax or $0.12
per share) gain recognized on the liquidation and dissolution of Rural Telephone Bank.
(7) Operating results include pre-tax acquisition and integration costs of $137.1 million ($85.7 million after tax or
$0.13 per share) and $28.3 million ($17.8 million after tax or $0.06 per share) for 2010 and 2009, respectively.
29
FRONTIER COMMUNICATIONS CORPORATION AND SUBSIDIARIES