Frontier Communications 2010 Annual Report Download - page 39
Download and view the complete annual report
Please find page 39 of the 2010 Frontier Communications annual report below. You can navigate through the pages in the report by either clicking on the pages listed below, or by using the keyword search tool below to find specific information within the annual report.-
 1
1 -
2
-
3
-
4
-
5
-
6
-
7
-
8
-
9
-
10
-
11
-
12
-
13
-
14
-
15
-
16
-
17
-
18
-
19
-
20
-
21
-
22
-
23
-
24
-
25
-
26
-
27
-
28
-
 29
29 -
 30
30 -
 31
31 -
 32
32 -
 33
33 -
 34
34 -
 35
35 -
 36
36 -
 37
37 -
 38
38 -
 39
39 -
 40
40 -
 41
41 -
 42
42 -
 43
43 -
 44
44 -
 45
45 -
 46
46 -
 47
47 -
 48
48 -
 49
49 -
50
-
51
-
52
-
53
-
54
-
55
-
56
-
57
-
58
-
59
-
60
-
61
-
62
-
63
-
64
-
65
-
66
-
67
-
68
-
69
-
70
-
71
-
72
-
73
-
74
-
75
-
76
-
77
-
78
-
79
-
80
-
81
-
82
-
83
-
84
-
85
-
86
-
87
-
88
-
89
-
90
-
91
-
92
-
93
-
94
-
95
-
96
-
97
-
98
-
99
-
100
-
101
-
102
-
103
-
104
 |
 |

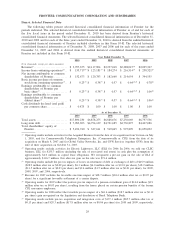
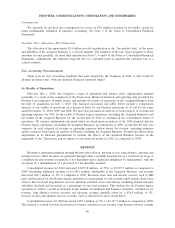
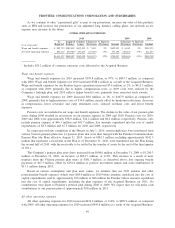
Goodwill by reporting unit (operating segment) at December 31, 2010 is as follows:
($ in thousands) Northeast Southeast West Central Midwest
Reporting Units
Goodwill . . . . . . . . . . . . . . . . . . . . . $1,098,211 $1,275,633 $1,525,687 $1,576,898 $815,765
Prior to the Transaction, and the related increase in operating segments, we reorganized our management
and operating structure during the first quarter of 2009 to include our Rochester market with our existing New
York State properties and the rest of the East Region. At that time, we determined that no impairment was
indicated at both December 31, 2008 and March 31, 2009 for either the East or Rochester reporting units and
combining them did not alter the conclusion at either date.
We estimate fair value in two ways: (1) marketplace company comparison based and (2) equity based
utilizing our share price. Enterprise values for rural ILEC properties are typically quoted as a multiple of cash
flow or EBITDA. Marketplace company comparisons and analyst reports support a range of values around a
multiple of 6 to 6.5 times annualized EBITDA. For the purpose of the goodwill impairment test we define
EBITDA as operating income plus depreciation and amortization. We determined the fair value estimates using
6.5 times EBITDA but also used lower EBITDA multiples to gauge the sensitivity of the estimate and its effect
on the margin of excess of fair value over the carrying values of the reporting units. Additionally, a second test
was performed using our public market equity value or market capitalization. Market capitalization (current
market stock price times total shares outstanding) is a public market indicator of equity value and is useful in
corroborating the 6.5 times EBITDA valuation because we are singularly engaged in rural ILEC operating
activities. Our stock price on December 31, 2010 was $9.73 and when compared to the fair value using the
EBITDA multiple obtained above, exceeded such value before consideration of any applicable control
premium. We also used lower per share stock prices to gauge the sensitivity of the estimate and its effect on the
margin of excess fair value over the carrying value. Total market capitalization determined in this manner is
then allocated to the reporting units based upon each unit’s relative share of consolidated EBITDA. Our method
of determining fair value has been consistently applied for the three years ending December 31, 2010.
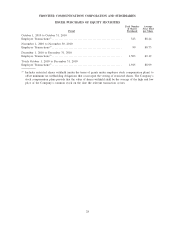
Depreciation and Amortization
The calculation of depreciation and amortization expense is based on the estimated economic useful lives
of the underlying property, plant and equipment and identifiable intangible assets. An independent study
updating the estimated remaining useful lives of our property, plant and equipment assets is performed
annually. We revised our useful lives for Frontier legacy plant assets, and the plant assets of the Acquired
Business, based on the study effective October 1, 2010. For the plant assets of the Acquired Business, an
independent study was performed to develop the appropriate depreciation rates based on Frontier’s existing
rates, while also incorporating factors unique to the plant assets of the Acquired Business. The “composite
depreciation rate” for our plant assets is 7.6% as a result of the study.
Intangible assets acquired in the Transaction were recorded based on an estimated fair value of $2.5 billion
and an estimated useful life of nine years for the residential customer list, as distinguished from the 12 years
used for the business customer list. For both classes of assets, the “sum of the years digits” method was used to
amortize the intangible assets, which tracks more closely with the projected revenue stream of each asset class.
Our Frontier legacy customer list intangible assets do not distinguish between residential and business classes
and the amortization period is five years on the straight-line method. We periodically reassess the useful life of
our intangible assets to determine whether any changes to those lives are required.
We anticipate depreciation expense of approximately $820.0 million to $840.0 million and amortization
expense of approximately $510.0 million for 2011.
Pension and Other Postretirement Benefits
Our estimates of pension expense, other postretirement benefits including retiree medical benefits and
related liabilities are “critical accounting estimates.” In connection with the completion of the Merger on July
1, 2010, certain employees were transferred from various Verizon pension plans into 12 pension plans that were
then merged with the Frontier Communications Pension Plan (the Plan) effective August 31, 2010. Assets of
38
FRONTIER COMMUNICATIONS CORPORATION AND SUBSIDIARIES