Frontier Communications 2010 Annual Report Download - page 41
Download and view the complete annual report
Please find page 41 of the 2010 Frontier Communications annual report below. You can navigate through the pages in the report by either clicking on the pages listed below, or by using the keyword search tool below to find specific information within the annual report.Contingencies
We currently do not have any contingencies in excess of $5.0 million recorded on our books, except for
items preliminarily estimated in purchase accounting. See Note 3 of the Notes to Consolidated Financial
Statements.
Purchase Price Allocation—The Transaction
The allocation of the approximate $5.4 billion in total consideration to the “fair market value” of the assets
and liabilities of the Acquired Business is a critical estimate. The estimates of the fair values assigned to plant,
customer list and goodwill, are more fully described in Notes 3, 4 and 6 of the Notes to Consolidated Financial
Statements. Additionally, the estimated expected life of a customer (used to amortize the customer list) is a
critical estimate.
New Accounting Pronouncements
There were no new accounting standards that were adopted by the Company in 2010, or that would be
adopted in future years, with any material financial statement impact.
(b) Results of Operations
Effective July 1, 2010, the Company’s scope of operations and balance sheet capitalization changed
materially as a result of the completion of the Transaction. Historical financial and operating data presented for
Frontier is not indicative of future results and includes the results of operations of the Acquired Business from
the date of acquisition on July 1, 2010. The financial discussion and tables below include a comparative
analysis of our results of operations on a historical basis for our Frontier operations as of and for the years
ended December 31, 2010, 2009 and 2008. We have also presented an analysis of each category of revenue and
operating expenses for 2010 for the results of Frontier legacy operations (excluding the Acquired Business) and
the results of the Acquired Business for the second half of 2010, as included in the consolidated results of
operations. All variance explanations discussed below are based upon an analysis of the 2010 financial data for
Frontier legacy operations (excluding the Acquired Business) in comparison to 2009, except that the first two
sentences in each category of revenue or operating expenses below shows the revenue, operating expenses
and/or variances based upon an analysis of Frontier including the Acquired Business. Frontier has shown these
adjustments to its financial presentations to exclude the effects of the Acquired Business because of the
magnitude of the Transaction and its impact to our financial results in 2010, as compared to 2009.
REVENUE
Revenue is generated primarily through the provision of local, network access, long distance, and data and
internet services. Such revenues are generated through either a monthly recurring fee or a fee based on usage at
a tariffed rate and revenue recognition is not dependent upon significant judgments by management, with the
exception of a determination of a provision for uncollectible amounts.
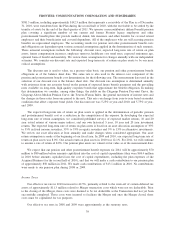
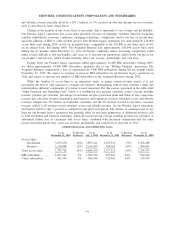
Consolidated revenue for 2010 increased $1,679.8 million, or 79%, to $3,797.7 million as compared to
2009. Excluding additional revenue of $1,748.1 million attributable to the Acquired Business, our revenue
decreased $68.3 million, or 3% as compared to 2009. Revenues from data and internet services such as HSI
grew and increased for our Frontier legacy properties as a percentage of total revenues and revenues from voice
services like local and long distance services and from switched access and subsidy (including federal and state
subsidies) declined and decreased as a percentage of our total revenues. This decline for our Frontier legacy
operations in 2010 is a result of decreases in the number of residential and business customers, switched access
revenue, long distance services revenue and directory revenue, partially offset by a $28.8 million, or 5%,
increase in data and internet services revenue, each as described in more detail below.
Consolidated revenue for 2009 decreased $119.1 million, or 5%, to $2,117.9 million as compared to 2008.
This decline is a result of lower local services revenue, switched access revenue, long distance services revenue
40
FRONTIER COMMUNICATIONS CORPORATION AND SUBSIDIARIES


