Express Scripts 2011 Annual Report Download - page 93
Download and view the complete annual report
Please find page 93 of the 2011 Express Scripts annual report below. You can navigate through the pages in the report by either clicking on the pages listed below, or by using the keyword search tool below to find specific information within the annual report.-
 1
1 -
2
-
3
-
4
-
5
-
6
-
7
-
8
-
9
-
10
-
11
-
12
-
13
-
14
-
15
-
16
-
17
-
18
-
19
-
20
-
21
-
22
-
23
-
24
-
25
-
26
-
27
-
28
-
29
-
30
-
31
-
32
-
33
-
34
-
35
-
36
-
37
-
38
-
39
-
40
-
41
-
42
-
43
-
44
-
45
-
46
-
47
-
48
-
49
-
50
-
51
-
52
-
53
-
54
-
55
-
56
-
57
-
58
-
59
-
60
-
61
-
62
-
63
-
64
-
65
-
66
-
67
-
68
-
69
-
70
-
71
-
72
-
73
-
74
-
75
-
76
-
77
-
78
-
79
-
80
-
81
-
82
-
 83
83 -
 84
84 -
 85
85 -
 86
86 -
 87
87 -
 88
88 -
 89
89 -
 90
90 -
 91
91 -
 92
92 -
 93
93 -
 94
94 -
 95
95 -
 96
96 -
 97
97 -
 98
98 -
 99
99 -
 100
100 -
 101
101 -
 102
102 -
 103
103 -
104
-
105
-
106
-
107
-
108
 |
 |

Express Scripts 2011 Annual Report 91
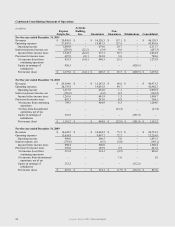
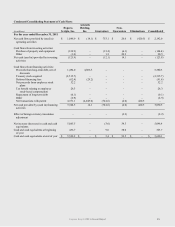
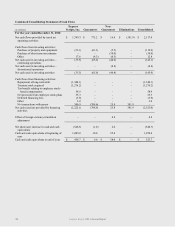
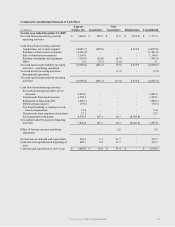
Condensed Consolidating Statement of Cash Flows
(in millions)
Express
Scripts, Inc.
Guarantors
Non-
Guarantors
Eliminations
Consolidated
For the year ended December 31, 2009
Net cash flows provided by (used in)
operating activities
$
1,684.9
$
385.2
$
13.6
$
(312.2)
$
1,771.5
Cash flows from investing activities:
Acquisitions, net of cash acquired
(8,881.7)
(465.9)
-
4,675.0
(4,672.6)
Purchase of short-term investments
(1,201.4)
-
-
-
(1,201.4)
Sale of short-term investments
1,198.9
-
-
-
1,198.9
Purchase of property and equipment
(116.6)
(22.6)
(8.3)
-
(147.5)
Other
6.4
(2.7)
(1.6)
-
2.1
Net cash (used in) provided by investing
activities – continuing operations
(8,994.4)
(491.2)
(9.9)
4,675.0
(4,820.5)
Net cash used in investing activities –
discontinued operations
-
-
(1.9)
-
(1.9)
Net cash (used in) provided by investing
activities
(8,994.4)
(491.2)
(11.8)
4,675.0
(4,822.4)
Cash flows from financing activities:
Proceeds from long-term debt, net of
discounts
2,491.6
-
-
-
2,491.6
Net proceeds from stock issuance
1,569.1
-
-
-
1,569.1
Repayment of long-term debt
(420.1)
-
-
-
(420.1)
Deferred financing fees
(79.5)
-
-
-
(79.5)
Tax benefit relating to employee stock-
based compensation
13.4
-
-
-
13.4
Net proceeds from employee stock plans
12.5
-
-
-
12.5
Net transactions with parent
4,239.4
107.1
16.3
(4,362.8)
-
Net cash provided by (used in) financing
activities
7,826.4
107.1
16.3
(4,362.8)
3,587.0
Effect of foreign currency translation
adjustment
-
-
3.6
-
3.6
Net increase in cash and cash equivalents
516.9
1.1
21.7
-
539.7
Cash and cash equivalents at beginning of
year
488.1
8.9
33.7
-
530.7
Cash and cash equivalents at end of year
$
1,005.0
$
10.0
$
55.4
$
-
$
1,070.4