Express Scripts 2011 Annual Report Download - page 41
Download and view the complete annual report
Please find page 41 of the 2011 Express Scripts annual report below. You can navigate through the pages in the report by either clicking on the pages listed below, or by using the keyword search tool below to find specific information within the annual report.-
 1
1 -
2
-
3
-
4
-
5
-
6
-
7
-
8
-
9
-
10
-
11
-
12
-
13
-
14
-
15
-
16
-
17
-
18
-
19
-
20
-
21
-
22
-
23
-
24
-
25
-
26
-
27
-
28
-
29
-
30
-
 31
31 -
 32
32 -
 33
33 -
 34
34 -
 35
35 -
 36
36 -
 37
37 -
 38
38 -
 39
39 -
 40
40 -
 41
41 -
 42
42 -
 43
43 -
 44
44 -
 45
45 -
 46
46 -
 47
47 -
 48
48 -
 49
49 -
 50
50 -
 51
51 -
52
-
53
-
54
-
55
-
56
-
57
-
58
-
59
-
60
-
61
-
62
-
63
-
64
-
65
-
66
-
67
-
68
-
69
-
70
-
71
-
72
-
73
-
74
-
75
-
76
-
77
-
78
-
79
-
80
-
81
-
82
-
83
-
84
-
85
-
86
-
87
-
88
-
89
-
90
-
91
-
92
-
93
-
94
-
95
-
96
-
97
-
98
-
99
-
100
-
101
-
102
-
103
-
104
-
105
-
106
-
107
-
108
 |
 |

Express Scripts 2011 Annual Report 39
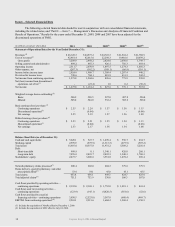
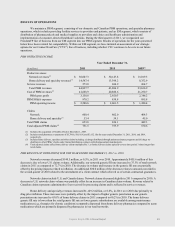
(3) Includes the acquisition of CYC effective October 10, 2007.
(4) Includes retail pharmacy co-payments of $5,786.6, $6,181.4, $3,132.1, $3,153.6, and $3,554.5 for the years ended December 31, 2011, 2010, 2009,
2008, and 2007, respectively. We changed our accounting policy for member co-payments during the third quarter of 2008 to include member co-
payments to retail pharmacies in revenue and cost of revenue. The table reflects the change in our accounting policy for all periods presented.
(5) Primarily consists of the results of operations from the discontinued operations of PMG and Infusion Pharmacy (―IP‖), which were classified as a
discontinued operation in the second quarter of 2010 and the fourth quarter of 2007, respectively.
(6) Earnings per share and weighted average shares outstanding have been restated to reflect the two-for-one stock splits effective June 8, 2010 and June
22, 2007, respectively.
(7) Excluded from the network claims are manual claims and drug formulary only claims where we only administer the client’s formulary.
(8) These claims include home delivery, specialty and other claims including: (a) drugs distributed through patient assistance programs (b) drugs we
distribute to other PBMs’ clients under limited distribution contracts with pharmaceutical manufacturers and (c) FreedomFP claims.
(9) Total adjusted claims reflect home delivery claims multiplied by 3, as home delivery claims typically cover a time period 3 times longer than retail
claims.
(10) EBITDA from continuing operations is earnings before other income (expense), interest, taxes, depreciation and amortization, or alternatively
calculated as operating income plus depreciation and amortization. EBITDA is presented because it is a widely accepted indicator of a company’s
ability to service indebtedness and is frequently used to evaluate a company’s performance. EBITDA, however, should not be considered as an
alternative to net income, as a measure of operating performance, as an alternative to cash flow, as a measure of liquidity or as a substitute for any
other measure computed in accordance with accounting principles generally accepted in the United States. In addition, our definition and calculation
of EBITDA may not be comparable to that used by other companies.
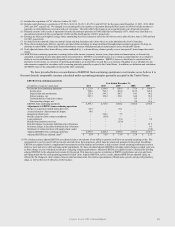
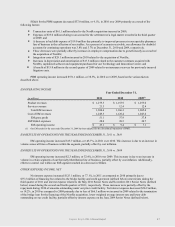
We have provided below a reconciliation of EBITDA from continuing operations to net income as we believe it is
the most directly comparable measure calculated under accounting principles generally accepted in the United States:
EBITDA from continuing operations
Year Ended December 31,
(in millions, except per claim data)
2011
2010
2009
2008
2007
Net income from continuing operations
$ 1,275.8
$ 1,204.6
$ 826.6
$ 775.9
$ 598.0
Income taxes
748.6
704.1
481.8
431.5
342.2
Depreciation and amortization
253.4
244.7
106.7
94.1
94.2
Interest expense, net
287.3
162.2
189.1
64.6
96.2
Undistributed loss from joint venture
-
-
-
0.3
1.3
Non-operating charges, net
-
-
-
2.0
18.6
EBITDA from continuing operations
2,565.1
2,315.6
1,604.2
1,368.4
1,150.5
Adjustments to EBITDA from continuing operations
Merger or acquisition-related transaction costs
62.5
-
61.1
-
-
Accrual related to client contractual dispute
30.0
-
-
-
-
Integration-related costs
-
122.6
7.5
-
-
Benefit related to client contract amendment
-
(30.0)
-
-
-
Legal settlement
-
-
35.0
-
6.0
Benefit from insurance recovery
-
-
(15.0)
-
-
Bad debt charges in specialty distribution line of business
-
-
-
-
21.5
Inventory charges in specialty distribution line of business
-
-
-
-
9.1
Settlement of contractual item with supply chain vendor
-
-
-
-
(9.0)
Adjusted EBITDA from continuing operations
2,657.6
2,408.2
1,692.8
1,368.4
1,178.1
Adjusted EBITDA per adjusted claim(1)
$ 3.54
$ 3.19
$ 3.19
$ 2.70
$ 2.32
(1) We calculate and use adjusted EBITDA per adjusted claim as an indicator of our ability to generate cash from our reported operating results. This
measurement is used in concert with net income and cash flows from operations, which measure actual cash generated in the period. In addition,
EBITDA per adjusted claim is a supplemental measurement used by analysts and investors to help evaluate overall operating performance and our
ability to incur and service debt and make capital expenditures. We have calculated adjusted EBITDA excluding certain charges recorded each year,
as these charges are not considered an indicator of ongoing company performance. Adjusted EBITDA per adjusted claim is calculated by dividing
adjusted EBITDA by the adjusted claim volume for the period. This measure is used as an indicator of EBITDA performance on a per-unit basis,
providing insight into the cash-generating potential of each claim. Adjusted EBITDA, and as a result, adjusted EBITDA per adjusted claim, are
affected by the changes in claim volumes between retail and mail-order, the relative representation of brand-name, generic and specialty pharmacy
drugs, as well as the level of efficiency in the business.