Express Scripts 2011 Annual Report Download - page 61
Download and view the complete annual report
Please find page 61 of the 2011 Express Scripts annual report below. You can navigate through the pages in the report by either clicking on the pages listed below, or by using the keyword search tool below to find specific information within the annual report.-
 1
1 -
2
-
3
-
4
-
5
-
6
-
7
-
8
-
9
-
10
-
11
-
12
-
13
-
14
-
15
-
16
-
17
-
18
-
19
-
20
-
21
-
22
-
23
-
24
-
25
-
26
-
27
-
28
-
29
-
30
-
31
-
32
-
33
-
34
-
35
-
36
-
37
-
38
-
39
-
40
-
41
-
42
-
43
-
44
-
45
-
46
-
47
-
48
-
49
-
50
-
 51
51 -
 52
52 -
 53
53 -
 54
54 -
 55
55 -
 56
56 -
 57
57 -
 58
58 -
 59
59 -
 60
60 -
 61
61 -
 62
62 -
 63
63 -
 64
64 -
 65
65 -
 66
66 -
 67
67 -
 68
68 -
 69
69 -
 70
70 -
 71
71 -
72
-
73
-
74
-
75
-
76
-
77
-
78
-
79
-
80
-
81
-
82
-
83
-
84
-
85
-
86
-
87
-
88
-
89
-
90
-
91
-
92
-
93
-
94
-
95
-
96
-
97
-
98
-
99
-
100
-
101
-
102
-
103
-
104
-
105
-
106
-
107
-
108
 |
 |

Express Scripts 2011 Annual Report 59
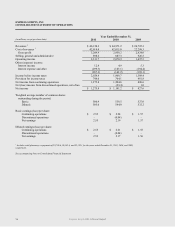
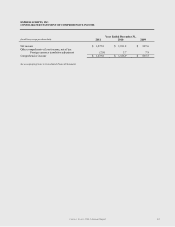
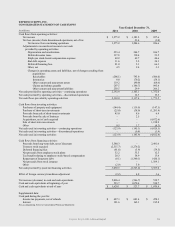
EXPRESS SCRIPTS, INC.
CONSOLIDATED STATEMENT OF CASH FLOWS
Year Ended December 31,
(in millions)
2011
2010
2009
Cash flows from operating activities:
Net income
$ 1,275.8
$ 1,181.2
$ 827.6
Net loss (income) from discontinued operations, net of tax
-
23.4
(1.0)
Net income from continuing operations 1,275.8 1,204.6 826.6
Adjustments to reconcile net income to net cash
provided by operating activities:
Depreciation and amortization
253.4
244.7
106.7
Deferred income taxes
137.8
110.4
51.5
Employee stock-based compensation expense
48.8
49.7
44.6
Bad debt expense
11.6
5.2
24.1
Deferred financing fees
81.0
5.1
66.3
Other, net
4.5
9.4
3.3
Changes in operating assets and liabilities, net of changes resulting from
acquisitions:
Receivables
(206.1)
793.0
(506.0)
Inventories 8.0 (70.2) (58.1)
Other current and noncurrent assets
119.2
(90.0)
(68.6)
Claims and rebates payable
207.5
(186.7)
995.4
Other current and noncurrent liabilities
250.5
29.9
266.2
Net cash provided by operating activities—continuing operations
2,192.0
2,105.1
1,752.0
Net cash provided by operating activities—discontinued operations - 12.3 19.5
Net cash flows provided by operating activities
2,192.0
2,117.4
1,771.5
Cash flows from investing activities:
Purchases of property and equipment (144.4) (119.9) (147.5)
Purchase of short-term investments
(25.0)
(38.0)
(1,201.4)
Proceeds from sale of short-term investments
45.0
8.6
6.4
Proceeds from the sale of business
-
2.5
-
Acquisitions, net of cash acquired
-
-
(4,672.6)
Sale of short-term investments
-
-
1,198.9
Other
0.5
1.7
(4.3)
Net cash used in investing activities—continuing operations
(123.9)
(145.1)
(4,820.5)
Net cash used in investing activities—discontinued operations
-
(0.8)
(1.9)
Net cash used in investing activities
(123.9)
(145.9)
(4,822.4)
Cash flows from financing activities:
Proceeds from long-term debt, net of discounts
5,580.3
-
2,491.6
Treasury stock acquired (2,515.7) (1,276.2) -
Deferred financing fees
(91.6)
(3.9)
(79.5)
Net proceeds from employee stock plans
32.2
35.3
12.5
Tax benefit relating to employee stock-based compensation
28.3
58.9
13.4
Repayment of long-term debt
(0.1)
(1,340.1)
(420.1)
Net proceeds from stock issuance
-
-
1,569.1
Other
(2.9)
3.0
-
Net cash provided by (used in) financing activities
3,030.5
(2,523.0)
3,587.0
Effect of foreign currency translation adjustment
(2.2)
4.8
3.6
Net increase (decrease) in cash and cash equivalents
5,096.4
(546.7)
539.7
Cash and cash equivalents at beginning of year
523.7
1,070.4
530.7
Cash and cash equivalents at end of year
$ 5,620.1
$ 523.7
$ 1,070.4
Supplemental data:
Cash paid during the year for:
Income tax payments, net of refunds
$ 487.3
$ 601.4
$ 478.3
Interest
181.6
162.3
185.8
See accompanying Notes to Consolidated Financial Statements