Express Scripts 2011 Annual Report Download - page 89
Download and view the complete annual report
Please find page 89 of the 2011 Express Scripts annual report below. You can navigate through the pages in the report by either clicking on the pages listed below, or by using the keyword search tool below to find specific information within the annual report.-
 1
1 -
2
-
3
-
4
-
5
-
6
-
7
-
8
-
9
-
10
-
11
-
12
-
13
-
14
-
15
-
16
-
17
-
18
-
19
-
20
-
21
-
22
-
23
-
24
-
25
-
26
-
27
-
28
-
29
-
30
-
31
-
32
-
33
-
34
-
35
-
36
-
37
-
38
-
39
-
40
-
41
-
42
-
43
-
44
-
45
-
46
-
47
-
48
-
49
-
50
-
51
-
52
-
53
-
54
-
55
-
56
-
57
-
58
-
59
-
60
-
61
-
62
-
63
-
64
-
65
-
66
-
67
-
68
-
69
-
70
-
71
-
72
-
73
-
74
-
75
-
76
-
77
-
78
-
 79
79 -
 80
80 -
 81
81 -
 82
82 -
 83
83 -
 84
84 -
 85
85 -
 86
86 -
 87
87 -
 88
88 -
 89
89 -
 90
90 -
 91
91 -
 92
92 -
 93
93 -
 94
94 -
 95
95 -
 96
96 -
 97
97 -
 98
98 -
 99
99 -
100
-
101
-
102
-
103
-
104
-
105
-
106
-
107
-
108
 |
 |

Express Scripts 2011 Annual Report 87
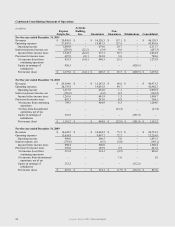
Condensed Consolidating Balance Sheet
(in millions) Express
Scripts, Inc.
Aristotle
Holding,
Inc.
Guarantors
Non-
Guarantors
Eliminations
Consolidated
As of December 31, 2011
Cash and cash equivalents
$
5,522.2
$
-
$
5.4
$
92.5
$
-
$
5,620.1
Restricted cash and investments
-
-
13.1
4.7
-
17.8
Receivables, net
1,289.4
-
592.3
34.0
-
1,915.7
Other current assets
33.8
-
453.1
17.5
-
504.4
Total current assets
6,845.4
-
1,063.9
148.7
-
8,058.0
Property and equipment, net
293.0
-
105.2
18.0
-
416.2
Investments in subsidiaries
6,812.6
-
-
-
(6,812.6)
-
Intercompany
-
4,057.3
3,953.8
-
(8,011.1)
-
Goodwill
2,921.4
-
2,538.8
25.5
-
5,485.7
Other intangible assets, net 1,331.4 29.2 256.8 3.5 - 1,620.9
Other assets
22.1
-
2.5
1.6
-
26.2
Total assets
$
18,225.9
$
4,086.5
$
7,921.0
$
197.3
$
(14,823.7)
$
15,607.0
Claims and rebates payable
$
2,873.5
$
-
$
0.6
$
-
$
-
$
2,874.1
Accounts payable 686.6 - 238.4 3.1 - 928.1
Accrued expenses
256.5
-
362.5
37.0
-
656.0
Current maturities of long-term debt
999.9
-
-
-
-
999.9
Total current liabilities 4,816.5 - 601.5 40.1 - 5,458.1
Long-term debt
2,989.9
4,086.5
-
-
-
7,076.4
Intercompany
7,899.1
-
-
112.0
(8,011.1)
-
Other liabilities
46.7
-
546.4
5.7
-
598.8
Stockholders’ equity
2,473.7
-
6,773.1
39.5
(6,812.6)
2,473.7
Total liabilities and stockholders’ equity $ 18,225.9 $ 4,086.5 $ 7,921.0 $ 197.3 $ (14,823.7) $ 15,607.0
As of December 31, 2010
Cash and cash equivalents
$
456.7
$
-
$
9.0
$
58.0
$
-
$
523.7
Restricted cash and investments
-
-
11.7
4.6
-
16.3
Receivables, net
1,175.6
-
536.2
9.1
-
1,720.9
Other current assets
249.0
-
396.0
35.4
-
680.4
Total current assets
1,881.3
-
952.9
107.1
-
2,941.3
Property and equipment, net
231.5
-
127.2
14.0
-
372.7
Investments in subsidiaries
6,382.2
-
-
-
(6,382.2)
-
Intercompany
-
-
3,214.0
-
(3,214.0)
-
Goodwill
2,921.4
-
2,538.8
26.0
-
5,486.2
Other intangible assets, net
1,426.2
-
294.8
4.0
-
1,725.0
Other assets
20.6
-
10.1
1.9
-
32.6
Total assets
$
12,863.2
$
-
$
7,137.8
$
153.0
$
(9,596.2)
$
10,557.8
Claims and rebates payable
$
2,664.9
$
-
$
1.6
$
-
$
-
$
2,666.5
Accounts payable
634.4
-
17.7
4.6
-
656.7
Accrued expenses
288.7
-
294.5
10.7
-
593.9
Current maturities of long-term debt
-
-
0.1
-
-
0.1
Total current liabilities 3,588.0 - 313.9 15.3 - 3,917.2
Long-term debt
2,493.7
-
-
-
-
2,493.7
Intercompany 3,094.8 - - 119.2 (3,214.0) -
Other liabilities
80.1
-
455.5
4.7
-
540.3
Stockholders’ equity
3,606.6
-
6,368.4
13.8
(6,382.2)
3,606.6
Total liabilities and stockholders’ equity $ 12,863.2 $ - $ 7,137.8 $ 153.0 $ (9,596.2) $ 10,557.8