Express Scripts 2011 Annual Report Download - page 40
Download and view the complete annual report
Please find page 40 of the 2011 Express Scripts annual report below. You can navigate through the pages in the report by either clicking on the pages listed below, or by using the keyword search tool below to find specific information within the annual report.-
 1
1 -
2
-
3
-
4
-
5
-
6
-
7
-
8
-
9
-
10
-
11
-
12
-
13
-
14
-
15
-
16
-
17
-
18
-
19
-
20
-
21
-
22
-
23
-
24
-
25
-
26
-
27
-
28
-
29
-
 30
30 -
 31
31 -
 32
32 -
 33
33 -
 34
34 -
 35
35 -
 36
36 -
 37
37 -
 38
38 -
 39
39 -
 40
40 -
 41
41 -
 42
42 -
 43
43 -
 44
44 -
 45
45 -
 46
46 -
 47
47 -
 48
48 -
 49
49 -
 50
50 -
51
-
52
-
53
-
54
-
55
-
56
-
57
-
58
-
59
-
60
-
61
-
62
-
63
-
64
-
65
-
66
-
67
-
68
-
69
-
70
-
71
-
72
-
73
-
74
-
75
-
76
-
77
-
78
-
79
-
80
-
81
-
82
-
83
-
84
-
85
-
86
-
87
-
88
-
89
-
90
-
91
-
92
-
93
-
94
-
95
-
96
-
97
-
98
-
99
-
100
-
101
-
102
-
103
-
104
-
105
-
106
-
107
-
108
 |
 |

Express Scripts 2011 Annual Report
38
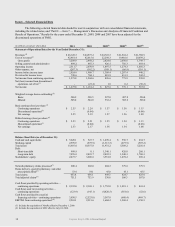
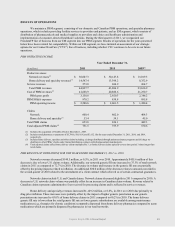
Item 6 – Selected Financial Data
The following selected financial data should be read in conjunction with our consolidated financial statements,
including the related notes, and ―Part II — Item 7 — Management’s Discussion and Analysis of Financial Condition and
Results of Operations.‖ Results for the years ended December 31, 2009, 2008 and 2007 have been adjusted for the
discontinued operations of PMG.
(in millions, except per share data)
2011
2010
2009
(1)
2008
(2)
2007
(3)
Statement of Operations Data (for the Year Ended December 31):
Revenues (4)
$ 46,128.3
$ 44,973.2
$ 24,722.3
$ 21,941.2
$ 21,788.9
Cost of revenues(4)
42,918.4
42,015.0
22,298.3
19,910.6
20,039.2
Gross profit
3,209.9
2,958.2
2,424.0
2,030.6
1,749.7
Selling, general and administrative
898.2
887.3
926.5
756.3
693.4
Operating income
2,311.7
2,070.9
1,497.5
1,274.3
1,056.3
Other expense, net
(287.3)
(162.2)
(189.1)
(66.9)
(116.1)
Income before income taxes
2,024.4
1,908.7
1,308.4
1,207.4
940.2
Provision for income taxes
748.6
704.1
481.8
431.5
342.2
Net income from continuing operations
1,275.8
1,204.6
826.6
775.9
598.0
Net (loss) income from discontinued
operations, net of tax(5)
-
(23.4)
1.0
0.2
(30.2)
Net income
$ 1,275.8
$ 1,181.2
$ 827.6
$ 776.1
$ 567.8
Weighted average shares outstanding:(6)
Basic:
500.9
538.5
527.0
497.8
520.8
Diluted:
505.0
544.0
532.2
503.6
528.0
Basic earnings (loss) per share:(6)
Continuing operations
$ 2.55
$ 2.24
$ 1.57
$ 1.56
$ 1.15
Discontinued operations(5)
-
(0.04)
-
-
(0.06)
Net earnings
2.55
2.19
1.57
1.56
1.09
Diluted earnings (loss) per share:(6)
Continuing operations
$ 2.53
$ 2.21
$ 1.55
$ 1.54
$ 1.13
Discontinued operations(5)
-
(0.04)
-
-
(0.06)
Net earnings
2.53
2.17
1.56
1.54
1.08
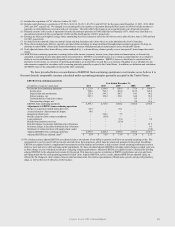
Balance Sheet Data (as of December 31):
Cash and cash equivalents
$ 5,620.1
$ 523.7
$ 1,070.4
$ 530.7
$ 434.7
Working capital
2,599.9
(975.9)
(1,313.3)
(677.9)
(507.2)
Total assets
15,607.0
10,557.8
11,931.2
5,509.2
5,256.4
Debt:
Short-term debt
999.9
0.1
1,340.1
420.0
260.1
Long-term debt
7,076.4
2,493.7
2,492.5
1,340.3
1,760.3
Stockholders’ equity
2,473.7
3,606.6
3,551.8
1,078.2
696.4
Network pharmacy claims processed(7)
600.4
602.0
404.3
379.6
379.9
Home delivery, specialty pharmacy, and other
prescriptions filled
(8)
53.4
54.1
45.0
45.1
45.5
Total claims
653.8
656.1
449.3
424.7
425.4
Total adjusted claims(9)
751.5
753.9
530.6
506.3
507.0
Cash flows provided by operating activities—
continuing operations
$ 2,192.0
$ 2,105.1
$ 1,752.0
$ 1,091.1
$ 841.4
Cash flows used in investing activities—
continuing operations
(123.9)
(145.1)
(4,820.5)
(318.6)
(52.6)
Cash flows provided by (used in)
financing activities—continuing operations
3,030.5
(2,523.0)
3,587.0
(680.4)
(469.7)
EBITDA from continuing operations(10)
2,565.1
2,315.6
1,604.2
1,368.4
1,150.5
(1) Includes the acquisition of NextRx effective December 1, 2009.
(2) Includes the acquisition of MSC effective July 22, 2008.