Express Scripts 2011 Annual Report Download - page 85
Download and view the complete annual report
Please find page 85 of the 2011 Express Scripts annual report below. You can navigate through the pages in the report by either clicking on the pages listed below, or by using the keyword search tool below to find specific information within the annual report.-
 1
1 -
2
-
3
-
4
-
5
-
6
-
7
-
8
-
9
-
10
-
11
-
12
-
13
-
14
-
15
-
16
-
17
-
18
-
19
-
20
-
21
-
22
-
23
-
24
-
25
-
26
-
27
-
28
-
29
-
30
-
31
-
32
-
33
-
34
-
35
-
36
-
37
-
38
-
39
-
40
-
41
-
42
-
43
-
44
-
45
-
46
-
47
-
48
-
49
-
50
-
51
-
52
-
53
-
54
-
55
-
56
-
57
-
58
-
59
-
60
-
61
-
62
-
63
-
64
-
65
-
66
-
67
-
68
-
69
-
70
-
71
-
72
-
73
-
74
-
 75
75 -
 76
76 -
 77
77 -
 78
78 -
 79
79 -
 80
80 -
 81
81 -
 82
82 -
 83
83 -
 84
84 -
 85
85 -
 86
86 -
 87
87 -
 88
88 -
 89
89 -
 90
90 -
 91
91 -
 92
92 -
 93
93 -
 94
94 -
 95
95 -
96
-
97
-
98
-
99
-
100
-
101
-
102
-
103
-
104
-
105
-
106
-
107
-
108
 |
 |

Express Scripts 2011 Annual Report 83
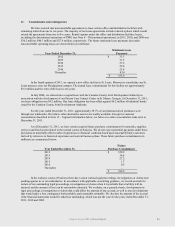
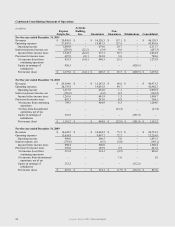
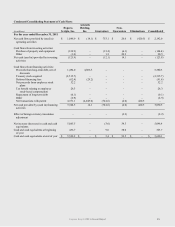
(in millions)
PBM
EM
Total
2011
Product revenues:
Network revenues
$ 30,007.3
$ -
$ 30,007.3
Home delivery and specialty revenues
14,547.4
-
14,547.4
Other revenues
-
1,279.3
1,279.3
Service revenues
273.0
21.3
294.3
Total revenues
44,827.7
1,300.6
46,128.3
Depreciation and amortization expense
245.5
7.9
253.4
Operating income
2,288.6
23.1
2,311.7
Interest income
12.4
Interest expense and other
(299.7)
Income before income taxes
2,024.4
Capital expenditures
141.1
3.3
144.4
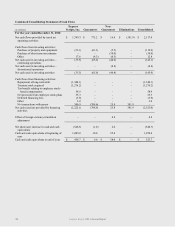
2010
Product revenues:
Network revenues
$ 30,147.8
$ -
$ 30,147.8
Home delivery and specialty revenues 13,398.2 - 13,398.2
Other revenues
-
1,153.9
1,153.9
Service revenues
260.9
12.4
273.3
Total revenues
43,806.9
1,166.3
44,973.2
Depreciation and amortization expense
236.9
7.8
244.7
Operating income
2,061.5
9.4
2,070.9
Interest income
4.9
Interest expense and other
(167.1)
Income before income taxes
1,908.7
Capital expenditures
116.9
3.0
119.9
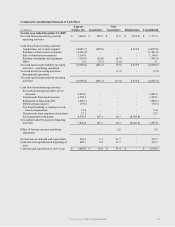
2009
Product revenues:
Network revenues
$ 15,019.3
$ -
$ 15,019.3
Home delivery and specialty revenues
8,352.9
-
8,352.9
Other revenues
-
1,073.0
1,073.0
Service revenues
264.7
12.4
277.1
Total revenues 23,636.9 1,085.4 24,722.3
Depreciation and amortization expense
98.3
8.4
106.7
Operating income
1,490.4
7.1
1,497.5
Interest income
5.3
Interest expense and other
(194.4)
Income before income taxes
1,308.4
Capital expenditures
145.4
2.1
147.5