Express Scripts 2011 Annual Report Download - page 48
Download and view the complete annual report
Please find page 48 of the 2011 Express Scripts annual report below. You can navigate through the pages in the report by either clicking on the pages listed below, or by using the keyword search tool below to find specific information within the annual report.-
 1
1 -
2
-
3
-
4
-
5
-
6
-
7
-
8
-
9
-
10
-
11
-
12
-
13
-
14
-
15
-
16
-
17
-
18
-
19
-
20
-
21
-
22
-
23
-
24
-
25
-
26
-
27
-
28
-
29
-
30
-
31
-
32
-
33
-
34
-
35
-
36
-
37
-
 38
38 -
 39
39 -
 40
40 -
 41
41 -
 42
42 -
 43
43 -
 44
44 -
 45
45 -
 46
46 -
 47
47 -
 48
48 -
 49
49 -
 50
50 -
 51
51 -
 52
52 -
 53
53 -
 54
54 -
 55
55 -
 56
56 -
 57
57 -
 58
58 -
59
-
60
-
61
-
62
-
63
-
64
-
65
-
66
-
67
-
68
-
69
-
70
-
71
-
72
-
73
-
74
-
75
-
76
-
77
-
78
-
79
-
80
-
81
-
82
-
83
-
84
-
85
-
86
-
87
-
88
-
89
-
90
-
91
-
92
-
93
-
94
-
95
-
96
-
97
-
98
-
99
-
100
-
101
-
102
-
103
-
104
-
105
-
106
-
107
-
108
 |
 |

Express Scripts 2011 Annual Report
46
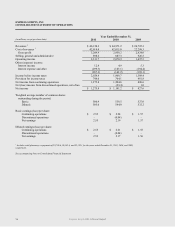
Total revenue for the year ended December 31, 2011 also includes charges of $30.0 million related to the
anticipated settlement of a contract dispute with a customer. See Note 11 – Commitments and contingencies for further
discussion of this contract dispute.
Cost of PBM revenues increased $782.3 million, or 1.9%, in 2011 when compared to the same period of 2010. The
increase during the period is due primarily to ingredient cost inflation as well as accelerated spending on certain projects in
2011 in order to create additional capacity to successfully complete integration activities for the proposed merger with
Medco in 2012. These increases were partially offset by a decrease in volume and an increase in the generic fill rate.
Additionally, included in cost of PBM revenues for the year ended December 31, 2010 is $94.5 million of integration costs
related to the acquisition of NextRx.
PBM gross profit increased $238.5 million, or 8.2%, in 2011 over 2010. Cost savings from the increase in the
aggregate generic fill rate and the completion of the NextRx integration in 2010 were partially offset by the decrease in
claims volume due to the adverse economic environment as described above.
Selling, general and administrative expense (―SG&A‖) for the PBM segment increased $11.4 million in 2011 over
2010. Costs of $62.5 million incurred during 2011 related to the Medco Transaction and accelerated spending on certain
projects in 2011, discussed above, as well as $11.0 million related to a proposed settlement of state tax audits, were
partially offset by decreases in management compensation as well as integration costs of $28.1 million during 2010 related
to the acquisition of NextRx.
PBM operating income increased $227.1 million, or 11.0 %, in 2011 over 2010, based on the various factors
described above.
PBM RESULTS OF OPERATIONS FOR THE YEAR ENDED DECEMBER 31, 2010 vs. 2009
Network revenues increased $15,128.5 million, or 100.7%, in 2010 over 2009. Home delivery and specialty
revenues increased $5,045.3 million, or 60.4%, in 2010 over 2009. Approximately $19,613.9 million of the total product
revenue increase is due to the increase in volume primarily due to the acquisition of NextRx in December 2009 and the new
contract with the DoD in November 2009. The new contract with the DoD results in utilization of the gross basis of
accounting, under which the ingredient cost and member co-payments are included in revenues and cost of revenues.
Additionally included as revenue is $30.0 million recorded in the second quarter of 2010 related to the amendment of a
client contract which relieved us of certain contractual guarantees. These increases were partially offset by the impact of
higher generic penetration. As our generic penetration rate increased to 72.7% of network claims and 60.2% of home
delivery claims in 2010 compared to 69.6% and 57.7%, respectively, in 2009, our revenues correspondingly decreased.
The home delivery generic fill rate is lower than the retail generic fill rate as fewer generic substitutions are
available among maintenance medications (e.g., therapies for chronic conditions) commonly dispensed from home delivery
pharmacies compared to acute medications which are primarily dispensed by pharmacies in our retail networks.
Cost of PBM revenues increased $19,635.9 million, or 92.4%, in 2010 when compared to the same period of 2009
due to the NextRx acquisition and the new contract with DoD, as previously discussed.
PBM gross profit increased $534.1 million, or 22.4%, in 2010 over 2009. Gross profit related to the acquisition of
NextRx as well as better management of ingredient costs and cost savings from the increase in the aggregate generic fill
rate were partially offset by margin pressures arising from the current competitive environment and costs of $94.5 million
incurred in 2010 related to the integration of NextRx. Gross profit margin decreased to 6.7% in 2010 from 10.1% in 2009.
This is primarily due to the new contract with the DoD, which is accounted for on a gross basis, as well as the acquisition of
NextRx. However, we expect margins to improve as we fully integrate NextRx into our core business and achieve
synergies.