Express Scripts 2011 Annual Report Download - page 67
Download and view the complete annual report
Please find page 67 of the 2011 Express Scripts annual report below. You can navigate through the pages in the report by either clicking on the pages listed below, or by using the keyword search tool below to find specific information within the annual report.-
 1
1 -
2
-
3
-
4
-
5
-
6
-
7
-
8
-
9
-
10
-
11
-
12
-
13
-
14
-
15
-
16
-
17
-
18
-
19
-
20
-
21
-
22
-
23
-
24
-
25
-
26
-
27
-
28
-
29
-
30
-
31
-
32
-
33
-
34
-
35
-
36
-
37
-
38
-
39
-
40
-
41
-
42
-
43
-
44
-
45
-
46
-
47
-
48
-
49
-
50
-
51
-
52
-
53
-
54
-
55
-
56
-
 57
57 -
 58
58 -
 59
59 -
 60
60 -
 61
61 -
 62
62 -
 63
63 -
 64
64 -
 65
65 -
 66
66 -
 67
67 -
 68
68 -
 69
69 -
 70
70 -
 71
71 -
 72
72 -
 73
73 -
 74
74 -
 75
75 -
 76
76 -
 77
77 -
78
-
79
-
80
-
81
-
82
-
83
-
84
-
85
-
86
-
87
-
88
-
89
-
90
-
91
-
92
-
93
-
94
-
95
-
96
-
97
-
98
-
99
-
100
-
101
-
102
-
103
-
104
-
105
-
106
-
107
-
108
 |
 |

Express Scripts 2011 Annual Report 65
Employee stock-based compensation. Grant-date fair values of stock options and ―stock-settled‖ stock
appreciation rights (―SSRs‖) are estimated using a Black-Scholes valuation model. Compensation expense is
reduced based on estimated forfeitures with adjustments recorded at the time of vesting when actual forfeitures are
greater than estimates. Forfeitures are estimated based on historical experience. We use an accelerated method of
recognizing compensation cost for awards with graded vesting, which essentially treats the grant as three separate
awards, with vesting periods of 12, 24 and 36 months for those grants that vest over three years.
See Note 10 – Employee benefit plans and stock-based compensation for more information regarding
stock-based compensation plans.
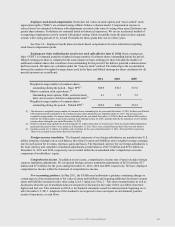
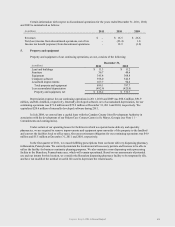
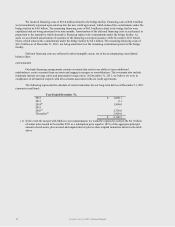
Earnings per share (reflecting the two-for-one stock split effective June 8, 2010). Basic earnings per
share (―EPS‖) is computed using the weighted average number of common shares outstanding during the period.
Diluted earnings per share is computed in the same manner as basic earnings per share but adds the number of
additional common shares that would have been outstanding for the period if the dilutive potential common shares
had been issued. All shares are calculated under the ―treasury stock‖ method. The following is the reconciliation
between the number of weighted average shares used in the basic and diluted earnings per share calculation for all
periods (amounts are in millions):
2011 2010 2009
Weighted average number of common shares
outstanding during the period – Basic EPS(1)
500.9
538.5
527.0
Dilutive common stock equivalents: (2)
Outstanding stock options, SSRs, restricted stock
units, and executive deferred compensation units
(3)
4.1
5.5
5.2
Weighted average number of common shares
outstanding during the period – Diluted EPS(1)
505.0
544.0
532.2
(1) The decrease in weighted average number of common shares outstanding for the year ended December 31, 2011 for Basic and Diluted
EPS resulted from the repurchase of 46.4 million treasury shares during the year ended December 31, 2011. The increase in the
weighted average number of common shares outstanding for the year ended December 31, 2010 for Basic and Diluted EPS resulted
from the 52.9 million shares issued in the common stock offering on June 10, 2009, partially offset by the repurchase of 26.9 million
treasury shares during the year ended December 31, 2010.
(2) Dilutive common stock equivalents do not include the 0.1 million shares that we would receive if the Accelerated Share Repurchase
agreement discussed in Note 9 were settled as of December 31, 2011. These were excluded because their effect was anti-dilutive.
(3) Excludes awards of 3.3 million, 2.8 million, and 1.6 million for the years ended December 31, 2011, 2010 and 2009, respectively.
These were excluded because their effect was anti-dilutive.
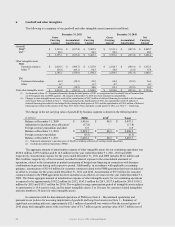
Foreign currency translation. The financial statements of our foreign subsidiaries are translated into U.S.
dollars using the exchange rate at each balance sheet date for assets and liabilities and a weighted average exchange
rate for each period for revenues, expenses, gains and losses. The functional currency for our foreign subsidiaries is
the local currency and cumulative translation adjustments (credit balances of $17.0 million and $19.8 million at
December 31, 2011 and 2010, respectively) are recorded within the accumulated other comprehensive income
component of stockholders’ equity.
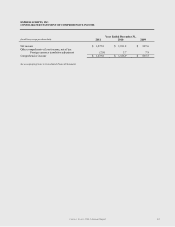
Comprehensive income. In addition to net income, comprehensive income (net of taxes) includes foreign
currency translation adjustments. We recognized foreign currency translation adjustments of $(2.8) million, $5.7
million and $7.9 million for the years ending December 31, 2011, 2010 and 2009, respectively. We have displayed
comprehensive income within the statement of comprehensive income.
New accounting guidance. In May 2011, the FASB issued authoritative guidance containing changes to
certain aspects of the measurement of fair value of assets and liabilities and requiring additional disclosures around
assets and liabilities measured at fair value using Level 3 inputs (see Note 2 – Fair value measurements) as well as
disclosures about the use of nonfinancial assets measured or disclosed at fair value if their use differs from their
highest and best use. This statement is effective for financial statements issued for annual periods beginning on or
after December 15, 2011. Adoption of the standard is not expected to have an impact on our financial position,
results of operations, or cash flows.