Express Scripts 2011 Annual Report Download - page 77
Download and view the complete annual report
Please find page 77 of the 2011 Express Scripts annual report below. You can navigate through the pages in the report by either clicking on the pages listed below, or by using the keyword search tool below to find specific information within the annual report.-
 1
1 -
2
-
3
-
4
-
5
-
6
-
7
-
8
-
9
-
10
-
11
-
12
-
13
-
14
-
15
-
16
-
17
-
18
-
19
-
20
-
21
-
22
-
23
-
24
-
25
-
26
-
27
-
28
-
29
-
30
-
31
-
32
-
33
-
34
-
35
-
36
-
37
-
38
-
39
-
40
-
41
-
42
-
43
-
44
-
45
-
46
-
47
-
48
-
49
-
50
-
51
-
52
-
53
-
54
-
55
-
56
-
57
-
58
-
59
-
60
-
61
-
62
-
63
-
64
-
65
-
66
-
 67
67 -
 68
68 -
 69
69 -
 70
70 -
 71
71 -
 72
72 -
 73
73 -
 74
74 -
 75
75 -
 76
76 -
 77
77 -
 78
78 -
 79
79 -
 80
80 -
 81
81 -
 82
82 -
 83
83 -
 84
84 -
 85
85 -
 86
86 -
 87
87 -
88
-
89
-
90
-
91
-
92
-
93
-
94
-
95
-
96
-
97
-
98
-
99
-
100
-
101
-
102
-
103
-
104
-
105
-
106
-
107
-
108
 |
 |

Express Scripts 2011 Annual Report 75
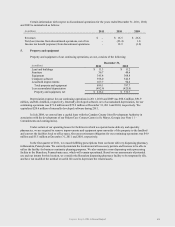
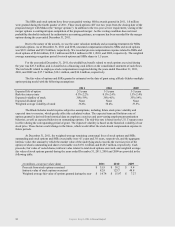
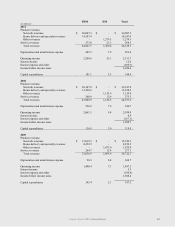
8. Income taxes
Income from continuing operations before income taxes of $2,024.4 million resulted in net tax expense of
$748.6 million for 2011. We consider our Canadian earnings to be indefinitely reinvested, and accordingly have not
recorded a provision for United States federal and state income taxes thereon. Cumulative undistributed Canadian
earnings for which United States taxes have not been provided are included in consolidated retained earnings in the
amount of $53.7 million, $43.7 million and $40.6 million as of December 31, 2011, 2010, and 2009, respectively.
Upon distribution of such earnings, we would be subject to United States income taxes of approximately $19.6
million.
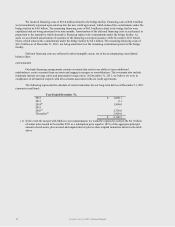
The provision (benefit) for income taxes for continuing operations consists of the following:
Year Ended December 31,
(in millions)
2011
2010
2009
Income from continuing operations before
income taxes:
United States
$ 2,026.7
$ 1,918.2
$ 1,312.4
Foreign
(2.3)
(9.5)
(4.0)
Total
$ 2,024.4
$ 1,908.7
$ 1,308.4
Current provision:
Federal
$ 565.2
$ 545.8
$ 407.7
State
42.5
40.3
25.6
Foreign
3.1
0.1
(1.8)
Total current provision
610.8
586.2
431.5
Deferred provision:
Federal
125.3
113.1
43.0
State
12.4
4.5
3.9
Foreign
0.1
0.3
3.4
Total deferred provision
137.8
117.9
50.3
Total current and deferred provision
$ 748.6
$ 704.1
$ 481.8
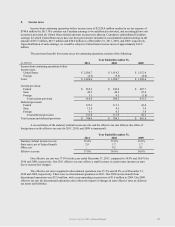
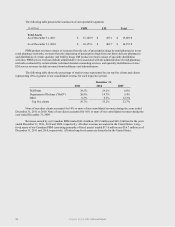
A reconciliation of the statutory federal income tax rate and the effective tax rate follows (the effect of
foreign taxes on the effective tax rate for 2011, 2010, and 2009 is immaterial):
Year Ended December 31,
2011
2010
2009
Statutory federal income tax rate
35.0%
35.0%
35.0%
State taxes, net of federal benefit
2.0
1.7
1.7
Other, net
-
0.2
0.1
Effective tax rate
37.0%
36.9%
36.8%
Our effective tax rate was 37.0% for the year ended December 31, 2011, compared to 36.9% and 36.8% for
2010 and 2009, respectively. Our 2011 effective tax rate reflects a small increase in certain state income tax rates
due to enacted law changes.
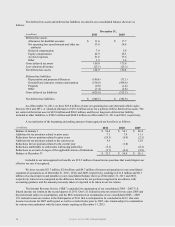
The effective tax rate recognized in discontinued operations was 35.5% and 68.8% as of December 31,
2010 and 2009, respectively. There were no discontinued operations in 2011. Our 2010 net tax benefit from
discontinued operations was $12.9 million, with a corresponding tax provision of $1.8 million in 2009. Our 2009
effective tax rate for discontinued operations also reflects the impact of changes in state effective rates on deferred
tax assets and liabilities.