Express Scripts 2011 Annual Report Download - page 47
Download and view the complete annual report
Please find page 47 of the 2011 Express Scripts annual report below. You can navigate through the pages in the report by either clicking on the pages listed below, or by using the keyword search tool below to find specific information within the annual report.-
 1
1 -
2
-
3
-
4
-
5
-
6
-
7
-
8
-
9
-
10
-
11
-
12
-
13
-
14
-
15
-
16
-
17
-
18
-
19
-
20
-
21
-
22
-
23
-
24
-
25
-
26
-
27
-
28
-
29
-
30
-
31
-
32
-
33
-
34
-
35
-
36
-
 37
37 -
 38
38 -
 39
39 -
 40
40 -
 41
41 -
 42
42 -
 43
43 -
 44
44 -
 45
45 -
 46
46 -
 47
47 -
 48
48 -
 49
49 -
 50
50 -
 51
51 -
 52
52 -
 53
53 -
 54
54 -
 55
55 -
 56
56 -
 57
57 -
58
-
59
-
60
-
61
-
62
-
63
-
64
-
65
-
66
-
67
-
68
-
69
-
70
-
71
-
72
-
73
-
74
-
75
-
76
-
77
-
78
-
79
-
80
-
81
-
82
-
83
-
84
-
85
-
86
-
87
-
88
-
89
-
90
-
91
-
92
-
93
-
94
-
95
-
96
-
97
-
98
-
99
-
100
-
101
-
102
-
103
-
104
-
105
-
106
-
107
-
108
 |
 |

Express Scripts 2011 Annual Report 45
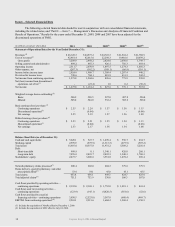
RESULTS OF OPERATIONS
We maintain a PBM segment, consisting of our domestic and Canadian PBM operations, and specialty pharmacy
operations, which includes providing fertility services to providers and patients, and an EM segment, which consists of
distribution of pharmaceuticals and medical supplies to providers and clinics and healthcare administration and
implementation of consumer-directed healthcare solutions. During the third quarter of 2011, we reorganized our
FreedomFP line of business from our EM segment into our PBM segment. Results of operations for the years presented
below have been restated for comparability. Within our EM segment, we have initiated an assessment of our strategic
options for our ConnectYourCare (―CYC‖) line of business, including whether CYC continues to be core to our future
operations.
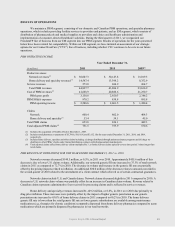
PBM OPERATING INCOME
Year Ended December 31,
(in millions)
2011
2010
2009
(1)
Product revenues:
Network revenues(2)
$ 30,007.3
$ 30,147.8
$ 15,019.3
Home delivery and specialty revenues(3)
14,547.4
13,398.2
8,352.9
Service revenues
273.0
260.9
264.7
Total PBM revenues
44,827.7
43,806.9
23,636.9
Cost of PBM revenues(2)
41,668.9
40,886.6
21,250.7
PBM gross profit
3,158.8
2,920.3
2,386.2
PBM SG&A expenses
870.2
858.8
895.8
PBM operating income
$ 2,288.6
$ 2,061.5
$ 1,490.4
Claims
Network
600.4
602.0
404.3
Home delivery and specialty(3)
53.4
54.1
45.0
Total PBM claims
653.8
656.1
449.3
Total adjusted PBM claims(4) 751.5 753.9 530.6
(1) Includes the acquisition of NextRx effective December 1, 2009.
(2) Includes retail pharmacy co-payments of $5,786.6, $6,181.4, and $3,132.1for the years ended December 31, 2011, 2010, and 2009,
respectively.
(3) Includes home delivery, specialty and other claims including: (a) drugs distributed through patient assistance programs and (b) drugs we
distribute to other PBMs’ clients under limited distribution contracts with pharmaceutical manufacturers.
(4) Total adjusted claims reflect home delivery claims multiplied by 3, as home delivery claims typically cover a time period 3 times longer than
retail claims.
PBM RESULTS OF OPERATIONS FOR THE YEAR ENDED DECEMBER 31, 2011 vs. 2010
Network revenues decreased $140.5 million, or 0.5%, in 2011 over 2010. Approximately $455.6 million of this
decrease is due to lower U.S. claims volume. Additionally, our network generic fill rate increased to 75.3% of total network
claims in 2011 as compared to 72.7% in 2010. The decrease in volume and increase in the generic fill rate are partially
offset by the pricing impacts related to inflation. An additional $30.0 million of the decrease relates to amounts recorded in
the second quarter of 2010 related to the amendment of a client contract which relieved us of certain contractual guarantees.
Network claims include U.S. and Canada claims. Network claims decreased slightly in 2011 compared to 2010. A
decrease in U.S. network claim volume was partially offset by an increase in Canadian claim volume. Revenue related to
Canadian claims represents administrative fees received for processing claims and is reflected in service revenues.
Home delivery and specialty revenues increased $1,149.2 million, or 8.6%, in 2011 over 2010 due primarily to
drug price inflation. These increases were partially offset by the impact of higher generic penetration as our generic
penetration rate increased to 63.0% of home delivery claims in 2011 compared to 60.2% in 2010. The home delivery
generic fill rate is lower than the retail generic fill rate as fewer generic substitutions are available among maintenance
medications (e.g., therapies for chronic conditions) commonly dispensed from home delivery pharmacies compared to acute
medications which are primarily dispensed by pharmacies in our retail networks.