Express Scripts 2011 Annual Report Download - page 86
Download and view the complete annual report
Please find page 86 of the 2011 Express Scripts annual report below. You can navigate through the pages in the report by either clicking on the pages listed below, or by using the keyword search tool below to find specific information within the annual report.-
 1
1 -
2
-
3
-
4
-
5
-
6
-
7
-
8
-
9
-
10
-
11
-
12
-
13
-
14
-
15
-
16
-
17
-
18
-
19
-
20
-
21
-
22
-
23
-
24
-
25
-
26
-
27
-
28
-
29
-
30
-
31
-
32
-
33
-
34
-
35
-
36
-
37
-
38
-
39
-
40
-
41
-
42
-
43
-
44
-
45
-
46
-
47
-
48
-
49
-
50
-
51
-
52
-
53
-
54
-
55
-
56
-
57
-
58
-
59
-
60
-
61
-
62
-
63
-
64
-
65
-
66
-
67
-
68
-
69
-
70
-
71
-
72
-
73
-
74
-
75
-
 76
76 -
 77
77 -
 78
78 -
 79
79 -
 80
80 -
 81
81 -
 82
82 -
 83
83 -
 84
84 -
 85
85 -
 86
86 -
 87
87 -
 88
88 -
 89
89 -
 90
90 -
 91
91 -
 92
92 -
 93
93 -
 94
94 -
 95
95 -
 96
96 -
97
-
98
-
99
-
100
-
101
-
102
-
103
-
104
-
105
-
106
-
107
-
108
 |
 |

Express Scripts 2011 Annual Report
84
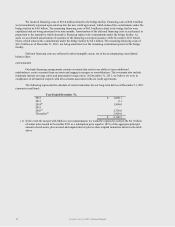
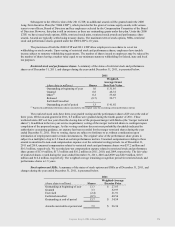
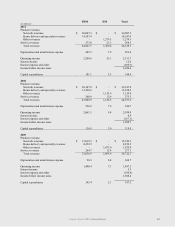
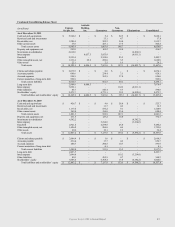
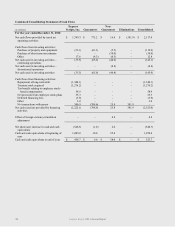
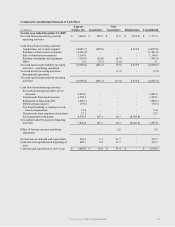
The following table presents the total assets of our reportable segments:
(in millions)
PBM
EM
Total
Total Assets
As of December 31, 2011
$ 15,149.9
$ 457.1
$ 15,607.0
As of December 31, 2010
$ 10,155.1
$ 402.7
$ 10,557.8
PBM product revenues consist of revenues from the sale of prescription drugs by retail pharmacies in our
retail pharmacy networks, revenues from the dispensing of prescription drugs from our home delivery pharmacies
and distribution of certain specialty and fertility drugs. EM product revenues consist of specialty distribution
activities. PBM service revenues include administrative fees associated with the administration of retail pharmacy
networks contracted by certain clients, informed decision counseling services, and specialty distribution services.
EM service revenues include revenues from healthcare card administration.
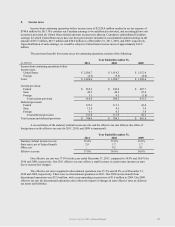
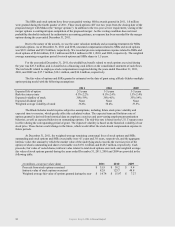
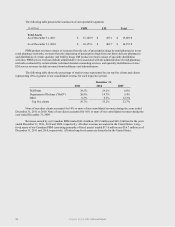
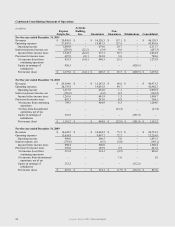
The following table shows the percentage of total revenue represented by our top five clients and clients
representing 10% or greater of our consolidated revenue for each respective period:
December 31,
2011
2010
2009
WellPoint
29.5%
29.2%
6.0%
Department of Defense (―DoD‖)
20.9%
19.7%
5.4%
Other
6.3%
6.3%
12.3%
Top five clients
56.7%
55.2%
23.7%
None of our other clients accounted for 10% or more of our consolidated revenues during the years ended
December 31, 2011 or 2010. None of our clients accounted for 10% or more of our consolidated revenues during the
year ended December 31, 2009.
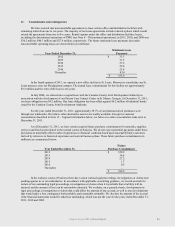
Revenues earned by our Canadian PBM totaled $62.4 million, $52.2 million and $49.2 million for the years
ended December 31, 2011, 2010 and 2009, respectively. All other revenues are earned in the United States. Long-
lived assets of our Canadian PBM (consisting primarily of fixed assets) totaled $17.6 million and $16.7 million as of
December 31, 2011 and 2010, respectively. All other long-lived assets are domiciled in the United States.