Energizer 2010 Annual Report Download - page 94
Download and view the complete annual report
Please find page 94 of the 2010 Energizer annual report below. You can navigate through the pages in the report by either clicking on the pages listed below, or by using the keyword search tool below to find specific information within the annual report.-
 1
1 -
2
-
3
-
4
-
5
-
6
-
7
-
8
-
9
-
10
-
11
-
12
-
13
-
14
-
15
-
16
-
17
-
18
-
19
-
20
-
21
-
22
-
23
-
24
-
25
-
26
-
27
-
28
-
29
-
30
-
31
-
32
-
33
-
34
-
35
-
36
-
37
-
38
-
39
-
40
-
41
-
42
-
43
-
44
-
45
-
46
-
47
-
48
-
49
-
50
-
51
-
52
-
53
-
54
-
55
-
56
-
57
-
58
-
59
-
60
-
61
-
62
-
63
-
64
-
65
-
66
-
67
-
68
-
69
-
70
-
71
-
72
-
73
-
74
-
75
-
76
-
77
-
78
-
79
-
80
-
81
-
82
-
83
-
 84
84 -
 85
85 -
 86
86 -
 87
87 -
 88
88 -
 89
89 -
 90
90 -
 91
91 -
 92
92 -
 93
93 -
 94
94 -
 95
95 -
 96
96 -
 97
97 -
 98
98 -
 99
99 -
 100
100 -
 101
101 -
 102
102 -
 103
103 -
 104
104 -
105
-
106
-
107
-
108
-
109
-
110
-
111
-
112
-
113
-
114
-
115
-
116
-
117
-
118
-
119
-
120
-
121
-
122
-
123
-
124
 |
 |

Exhibit 13
ENERGIZER HOLDINGS, INC.
(Dollars in millions, except per share and percentage data)
84
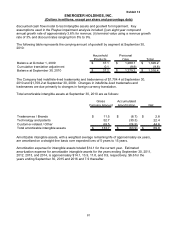
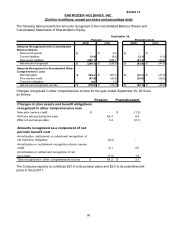
The Company classifies accrued interest and penalties related to unrecognized tax benefits in
the income tax provision. The Company accrued approximately $7.0 of interest and $0.7 of
penalties at September 30, 2010 and $6.7 of interest and $0.7 of penalties at September 30,
2009. Interest was computed on the difference between the tax position recognized in
accordance with GAAP and the amount previously taken or expected to be taken in the
Company’s tax returns.
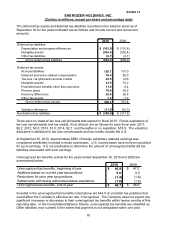
The Company files income tax returns in the U.S. federal jurisdiction, various cities and states,
and more than 40 foreign jurisdictions where the Company has operations. U.S. federal income
tax returns for tax years ended September 30, 2003 and after remain subject to examination by
the Internal Revenue Service. With few exceptions, the Company is no longer subject to state
and local income tax examinations for years before September 30, 2002. The status of
international income tax examinations varies by jurisdiction. The Company does not anticipate
any material adjustments to its financial statements resulting from tax examinations currently in
progress.
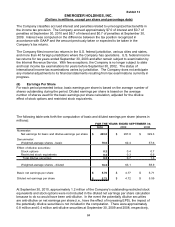
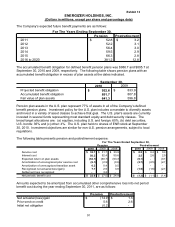
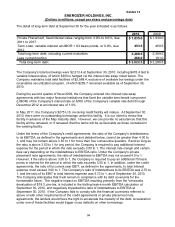
(6) Earnings Per Share
For each period presented below, basic earnings per share is based on the average number of
shares outstanding during the period. Diluted earnings per share is based on the average
number of shares used for the basic earnings per share calculation, adjusted for the dilutive
effect of stock options and restricted stock equivalents.
The following table sets forth the computation of basic and diluted earnings per share (shares in
millions):
2010 2009 2008
Numerator:
Net earnings for basic and dilutive earnings per share 403.0$ 297.8$ 329.3$
Denominator:
Weighted-average shares - basic 70.0 62.4 57.6
Effect of dilutive securities:
Stock options 0.2 0.4 0.7
Restricted stock equivalents 0.3 0.3 0.6
Total dilutive securities 0.5 0.7 1.3
Weighted-average shares - diluted 70.5 63.1 58.9
Basic net earnings per share 5.76$ 4.77$ 5.71$
Diluted net earnings per share 5.72$ 4.72$ 5.59$
FOR THE YEARS ENDED SEPTEMBER 30,
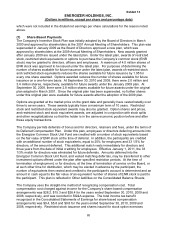
At September 30, 2010, approximately 1.2 million of the Company’s outstanding restricted stock
equivalents and stock options were not included in the diluted net earnings per share calculation
because to do so would have been anti-dilutive. In the event the potentially dilutive securities
are anti-dilutive on net earnings per share (i.e., have the effect of increasing EPS), the impact of
the potentially dilutive securities is not included in the computation. There were approximately
0.8 million and 0.4 million anti-dilutive securities at September 30, 2009 and 2008, respectively,