Energizer 2010 Annual Report Download - page 56
Download and view the complete annual report
Please find page 56 of the 2010 Energizer annual report below. You can navigate through the pages in the report by either clicking on the pages listed below, or by using the keyword search tool below to find specific information within the annual report.-
 1
1 -
2
-
3
-
4
-
5
-
6
-
7
-
8
-
9
-
10
-
11
-
12
-
13
-
14
-
15
-
16
-
17
-
18
-
19
-
20
-
21
-
22
-
23
-
24
-
25
-
26
-
27
-
28
-
29
-
30
-
31
-
32
-
33
-
34
-
35
-
36
-
37
-
38
-
39
-
40
-
41
-
42
-
43
-
44
-
45
-
 46
46 -
 47
47 -
 48
48 -
 49
49 -
 50
50 -
 51
51 -
 52
52 -
 53
53 -
 54
54 -
 55
55 -
 56
56 -
 57
57 -
 58
58 -
 59
59 -
 60
60 -
 61
61 -
 62
62 -
 63
63 -
 64
64 -
 65
65 -
 66
66 -
67
-
68
-
69
-
70
-
71
-
72
-
73
-
74
-
75
-
76
-
77
-
78
-
79
-
80
-
81
-
82
-
83
-
84
-
85
-
86
-
87
-
88
-
89
-
90
-
91
-
92
-
93
-
94
-
95
-
96
-
97
-
98
-
99
-
100
-
101
-
102
-
103
-
104
-
105
-
106
-
107
-
108
-
109
-
110
-
111
-
112
-
113
-
114
-
115
-
116
-
117
-
118
-
119
-
120
-
121
-
122
-
123
-
124
 |
 |

Exhibit 13
ENERGIZER HOLDINGS, INC.
(Dollars in millions, except per share and percentage data)
46
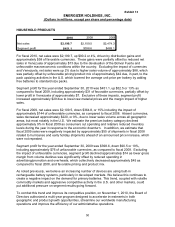
$5.59 per diluted share, in fiscal 2008. Total average shares outstanding increased in each of
the last two fiscal years due to the May 20, 2009 common stock issuance. Total average
diluted shares outstanding were 70.5 million, 63.1 million and 58.9 million for fiscal 2010, 2009
and 2008, respectively. Included in the current year results are:
• Charges:
- $14.2, after-tax, or $0.20 per diluted share, due primarily to the impact of the
devaluation of the Bolivar Fuerte for the Company’s Venezuela affiliate, and
- $7.3, after-tax, or $0.10 per diluted share, related to certain integration and other
business realignment activities.
• Income:
- $23.5 tax benefit, or $0.33 per diluted share, related to the favorable impact of a
foreign tax credit, and
- $6.1, or $0.09 per diluted share, related to the adjustment of prior years’ income tax
provisions.
Fiscal 2009 results included:
• Charges:
- $33.2, after-tax, or $0.53 per diluted share, related to the Company’s voluntary
enhanced retirement option (VERO) and reduction in force (RIF) programs, and
other business realignment and integration charges;
- $1.5, or $0.02 per diluted share, related to prior year income tax provision
adjustments; and
- $2.3, after-tax, or $0.04 per diluted share, related to the write-up and subsequent
sale of inventory purchased in the shave preparation acquisition.
• Income:
- $15.2, after-tax, or $0.24 per diluted share, due to the favorable impact of a change
in the Company’s paid time off policy (PTO).
Fiscal 2008 results included:
• an after-tax expense of $16.5, or $0.28 per diluted share, related to the write-up and
subsequent sale of inventory purchased in the Playtex acquisition;
• integration and other realignment costs of $13.4, after-tax, or $0.22 per diluted share,
and
• a net, unfavorable prior year income tax provision adjustment of $1.1, or $0.02 per
diluted share.
Operating Results
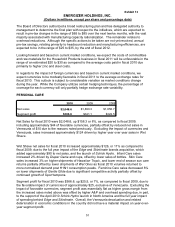
Net Sales
Net sales for fiscal 2010 were $4,248.3, an increase of $248.5, or 6%, as compared to fiscal
2009, including the favorable impact of currencies, other than Venezuela, of approximately
$100 and a year-over-year increase of approximately $90 from the full year ownership of the
Edge and Skintimate shave preparation brands. The total year growth was also positively
impacted by the Schick Hydro launch in the third quarter. The recent devaluation and difficult
economic conditions in Venezuela resulted in a reduction in net sales of approximately $23 in
fiscal 2010. Net sales in the Household Products division increased $90.2, or 4%, or