Energizer 2010 Annual Report Download - page 60
Download and view the complete annual report
Please find page 60 of the 2010 Energizer annual report below. You can navigate through the pages in the report by either clicking on the pages listed below, or by using the keyword search tool below to find specific information within the annual report.-
 1
1 -
2
-
3
-
4
-
5
-
6
-
7
-
8
-
9
-
10
-
11
-
12
-
13
-
14
-
15
-
16
-
17
-
18
-
19
-
20
-
21
-
22
-
23
-
24
-
25
-
26
-
27
-
28
-
29
-
30
-
31
-
32
-
33
-
34
-
35
-
36
-
37
-
38
-
39
-
40
-
41
-
42
-
43
-
44
-
45
-
46
-
47
-
48
-
49
-
 50
50 -
 51
51 -
 52
52 -
 53
53 -
 54
54 -
 55
55 -
 56
56 -
 57
57 -
 58
58 -
 59
59 -
 60
60 -
 61
61 -
 62
62 -
 63
63 -
 64
64 -
 65
65 -
 66
66 -
 67
67 -
 68
68 -
 69
69 -
 70
70 -
71
-
72
-
73
-
74
-
75
-
76
-
77
-
78
-
79
-
80
-
81
-
82
-
83
-
84
-
85
-
86
-
87
-
88
-
89
-
90
-
91
-
92
-
93
-
94
-
95
-
96
-
97
-
98
-
99
-
100
-
101
-
102
-
103
-
104
-
105
-
106
-
107
-
108
-
109
-
110
-
111
-
112
-
113
-
114
-
115
-
116
-
117
-
118
-
119
-
120
-
121
-
122
-
123
-
124
 |
 |

Exhibit 13
ENERGIZER HOLDINGS, INC.
(Dollars in millions, except per share and percentage data)
50
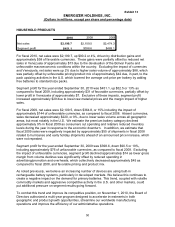
HOUSEHOLD PRODUCTS
2010 2009 2008
Net sales $2,199.7 $2,109.5 $2,474.3
Segment profit $451.1 $398.6 $489.1
For fiscal 2010, net sales were $2,199.7, up $90.2 or 4%, driven by distribution gains and
approximately $58 of favorable currencies. These gains were partially offset by reduced net
sales in Venezuela of approximately $13 due to the devaluation of the Bolivar Fuerte and
unfavorable macroeconomic conditions within the country. Excluding the impact of currencies
and Venezuela, net sales were up 2% due to higher sales volume of approximately $88, which
was partially offset by unfavorable pricing/product mix of approximately $42 due, in part, to the
pack upsizing activities in the U.S. which lowered the average unit price per battery by adding
free batteries to standard size packs.
Segment profit for the year ended September 30, 2010 was $451.1, up $52.5 or 13% as
compared to fiscal 2009, including approximately $31 of favorable currencies, partially offset by
lower profit in Venezuela of approximately $7. Exclusive of these impacts, segment profit
increased approximately $29 due to lower raw material prices and the margin impact of higher
sales.
For fiscal 2009, net sales were $2,109.5, down $364.8, or 15% including the impact of
approximately $144 of unfavorable currencies, as compared to fiscal 2008. Absent currencies,
sales decreased approximately $220, or 9%, due to lower sales volume across all geographic
areas, but most notably in the U.S. We estimate the premium battery category declined
approximately 9% in fiscal 2009 as consumers cut spending and retailers reduced inventory
levels during the year in response to the economic downturn. In addition, we estimate that
fiscal 2009 sales were negatively impacted by approximately $55 of shipments in fiscal 2008
related to hurricanes and early holiday shipments ahead of an announced price increase, which
were not repeated.
Segment profit for the year ended September 30, 2009 was $398.6, down $90.5 or 19%,
including approximately $76 of unfavorable currencies, as compared to fiscal 2008. Excluding
the impact of unfavorable currencies, segment profit declined approximately $14 as lower gross
margin from volume declines was significantly offset by reduced spending in
advertising/promotion and overheads, which collectively decreased approximately $45 as
compared to fiscal 2008, and favorable pricing and product mix.
As noted previously, we believe an increasing number of devices are using built-in
rechargeable battery systems, particularly in developed markets. We believe this continues to
create a negative impact on the demand for primary batteries. This trend, coupled with volatile
commodity markets and aggressive competitive activity in the U.S. and other markets, could
put additional pressure on segment results going forward.
To combat this trend and improve its competitive position, on November 1, 2010, the Board of
Directors authorized a multi-year program designed to accelerate investments in both
geographic and product growth opportunities, streamline our worldwide manufacturing
operations and improve the efficiency of our administrative operations.