Energizer 2010 Annual Report Download - page 91
Download and view the complete annual report
Please find page 91 of the 2010 Energizer annual report below. You can navigate through the pages in the report by either clicking on the pages listed below, or by using the keyword search tool below to find specific information within the annual report.-
 1
1 -
2
-
3
-
4
-
5
-
6
-
7
-
8
-
9
-
10
-
11
-
12
-
13
-
14
-
15
-
16
-
17
-
18
-
19
-
20
-
21
-
22
-
23
-
24
-
25
-
26
-
27
-
28
-
29
-
30
-
31
-
32
-
33
-
34
-
35
-
36
-
37
-
38
-
39
-
40
-
41
-
42
-
43
-
44
-
45
-
46
-
47
-
48
-
49
-
50
-
51
-
52
-
53
-
54
-
55
-
56
-
57
-
58
-
59
-
60
-
61
-
62
-
63
-
64
-
65
-
66
-
67
-
68
-
69
-
70
-
71
-
72
-
73
-
74
-
75
-
76
-
77
-
78
-
79
-
80
-
 81
81 -
 82
82 -
 83
83 -
 84
84 -
 85
85 -
 86
86 -
 87
87 -
 88
88 -
 89
89 -
 90
90 -
 91
91 -
 92
92 -
 93
93 -
 94
94 -
 95
95 -
 96
96 -
 97
97 -
 98
98 -
 99
99 -
 100
100 -
 101
101 -
102
-
103
-
104
-
105
-
106
-
107
-
108
-
109
-
110
-
111
-
112
-
113
-
114
-
115
-
116
-
117
-
118
-
119
-
120
-
121
-
122
-
123
-
124
 |
 |

Exhibit 13
ENERGIZER HOLDINGS, INC.
(Dollars in millions, except per share and percentage data)
81
discounted cash flow model to test intangible assets and goodwill for impairment. Key
assumptions used in the Playtex impairment analysis included (i) an eight year compound
annual growth rate of approximately 3.6% for revenue; (ii) terminal value using a revenue growth
rate of 3% and discount rates ranging from 8% to 9%.
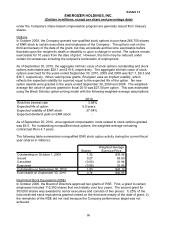
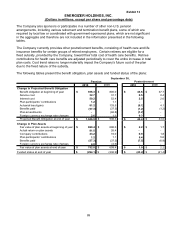
The following table represents the carrying amount of goodwill by segment at September 30,
2010:
Household Personal
Products Care Total
Balance at October 1, 2009 37.1$ 1,289.1$ 1,326.2$
Cumulative translation adjustment 0.1 (9.9) (9.8)
Balance at September 30, 2010 37.2$ 1,279.2$ 1,316.4$
The Company had indefinite-lived trademarks and tradenames of $1,704.4 at September 30,
2010 and $1,709.2 at September 30, 2009. Changes in indefinite-lived trademarks and
tradenames are due primarily to changes in foreign currency translation.
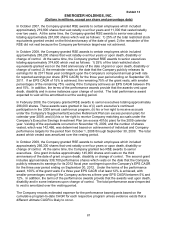
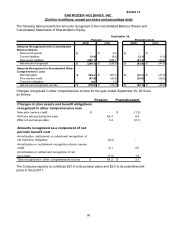
Total amortizable intangible assets at September 30, 2010 are as follows:
Gross Accumulated
Carrying Amount Amortization Net
Tradenames / Brands 11.5$ (8.7)$ 2.8$
Technology and patents 52.7 (30.3) 22.4
Customer-related / Other 69.5 (24.9) 44.6
Total amortizable intangible assets 133.7$ (63.9)$ 69.8$
Amortizable intangible assets, with a weighted average remaining life of approximately six years,
are amortized on a straight-line basis over expected lives of 5 years to 15 years.
Amortization expense for intangible assets totaled $14.1 for the current year. Estimated
amortization expense for amortizable intangible assets for the years ending September 30, 2011,
2012, 2013, and 2014, is approximately $14.1, 13.9, 11.8, and 8.9, respectively, $6.6 for the
years ending September 30, 2015 and 2016 and 7.9 thereafter.