Energizer 2010 Annual Report Download - page 63
Download and view the complete annual report
Please find page 63 of the 2010 Energizer annual report below. You can navigate through the pages in the report by either clicking on the pages listed below, or by using the keyword search tool below to find specific information within the annual report.-
 1
1 -
2
-
3
-
4
-
5
-
6
-
7
-
8
-
9
-
10
-
11
-
12
-
13
-
14
-
15
-
16
-
17
-
18
-
19
-
20
-
21
-
22
-
23
-
24
-
25
-
26
-
27
-
28
-
29
-
30
-
31
-
32
-
33
-
34
-
35
-
36
-
37
-
38
-
39
-
40
-
41
-
42
-
43
-
44
-
45
-
46
-
47
-
48
-
49
-
50
-
51
-
52
-
 53
53 -
 54
54 -
 55
55 -
 56
56 -
 57
57 -
 58
58 -
 59
59 -
 60
60 -
 61
61 -
 62
62 -
 63
63 -
 64
64 -
 65
65 -
 66
66 -
 67
67 -
 68
68 -
 69
69 -
 70
70 -
 71
71 -
 72
72 -
 73
73 -
74
-
75
-
76
-
77
-
78
-
79
-
80
-
81
-
82
-
83
-
84
-
85
-
86
-
87
-
88
-
89
-
90
-
91
-
92
-
93
-
94
-
95
-
96
-
97
-
98
-
99
-
100
-
101
-
102
-
103
-
104
-
105
-
106
-
107
-
108
-
109
-
110
-
111
-
112
-
113
-
114
-
115
-
116
-
117
-
118
-
119
-
120
-
121
-
122
-
123
-
124
 |
 |

Exhibit 13
ENERGIZER HOLDINGS, INC.
(Dollars in millions, except per share and percentage data)
53
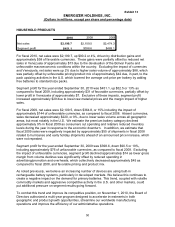
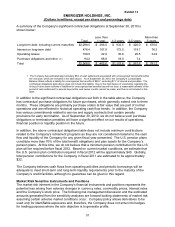
GENERAL CORPORATE AND OTHER EXPENSES
2010 2009 2008
General Corporate Expenses $100.8 $83.8 $83.8
Integration/Other Realignment 8.1 13.6 21.1
Sub-Total 108.9 97.4 104.9
VERO/Separation Costs - 38.6 -
PTO Policy Change - (24.1) -
Acquisition Inventory Valuation - 3.7 27.5
General Corporate and Other Expenses $108.9 $115.6 $132.4
% of Total Net Sales 2.6% 2.9% 3.1%
General Corporate and Other Expenses
For fiscal 2010, general corporate expenses, including integration/other realignment, increased
$11.5 as compared to fiscal 2009 due primarily to higher corporate compensation expenses
including higher annual incentive bonuses and stock award amortization.
For fiscal 2009, general corporate expenses, including integration/other realignment,
decreased $7.5 as compared to fiscal 2008 due primarily to lower Playtex integration costs,
which declined by $13.8 year over year. In addition, higher costs associated with certain
realignment activities in foreign affiliates were partially offset by lower corporate compensation
expenses.
In the fourth quarter of fiscal 2009, the Company implemented the VERO for eligible U.S.
colleagues. The decision to accept the cash benefits offered under the VERO was at the
election of the colleague and was irrevocable. Payments under the VERO were cash only, and
did not include any enhancement to pension or retirement benefits. In addition, the Company
implemented a RIF program primarily in the U.S., to further adjust the organizational structure.
The total charge for the VERO and RIF in the fourth quarter of fiscal 2009 was $38.6 and was
included in SG&A. Substantially all payments related to the VERO and RIF programs were
paid by the end of fiscal 2010.
Also in fiscal 2009, we recorded a favorable adjustment of $24.1, pre-tax, resulting from a
change in the policy under which colleagues earn and vest in the Company’s paid time off
(PTO) benefit. Prior to the change, colleagues were granted and vested in their total PTO days
at the beginning of the calendar year, and received a cash payment for unused days in the
event of termination during the year. As such, the value of a full year of PTO, net of days used,
was accrued at any given balance sheet date. As part of a review of certain benefit programs,
this policy was revised in fiscal 2009 to a more “market” policy for PTO. The revised policy has
an “earn as you go” approach, under which colleagues earn current-year PTO on a pro-rata
basis as they work during the year. As a result of this change, any previously earned and
vested benefit under the prior policy was forfeited, and the required liability at the date of the
policy change was adjusted to reflect the revised benefit.