Energizer 2010 Annual Report Download - page 101
Download and view the complete annual report
Please find page 101 of the 2010 Energizer annual report below. You can navigate through the pages in the report by either clicking on the pages listed below, or by using the keyword search tool below to find specific information within the annual report.-
 1
1 -
2
-
3
-
4
-
5
-
6
-
7
-
8
-
9
-
10
-
11
-
12
-
13
-
14
-
15
-
16
-
17
-
18
-
19
-
20
-
21
-
22
-
23
-
24
-
25
-
26
-
27
-
28
-
29
-
30
-
31
-
32
-
33
-
34
-
35
-
36
-
37
-
38
-
39
-
40
-
41
-
42
-
43
-
44
-
45
-
46
-
47
-
48
-
49
-
50
-
51
-
52
-
53
-
54
-
55
-
56
-
57
-
58
-
59
-
60
-
61
-
62
-
63
-
64
-
65
-
66
-
67
-
68
-
69
-
70
-
71
-
72
-
73
-
74
-
75
-
76
-
77
-
78
-
79
-
80
-
81
-
82
-
83
-
84
-
85
-
86
-
87
-
88
-
89
-
90
-
 91
91 -
 92
92 -
 93
93 -
 94
94 -
 95
95 -
 96
96 -
 97
97 -
 98
98 -
 99
99 -
 100
100 -
 101
101 -
 102
102 -
 103
103 -
 104
104 -
 105
105 -
 106
106 -
 107
107 -
 108
108 -
 109
109 -
 110
110 -
 111
111 -
112
-
113
-
114
-
115
-
116
-
117
-
118
-
119
-
120
-
121
-
122
-
123
-
124
 |
 |

Exhibit 13
ENERGIZER HOLDINGS, INC.
(Dollars in millions, except per share and percentage data)
91
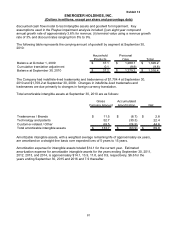
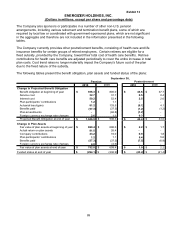
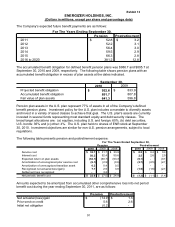
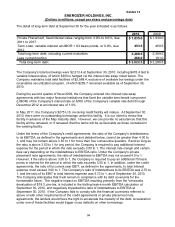
The Company’s expected future benefit payments are as follows:
For The Years Ending September 30,
Pension Postretirement
2011 52.8$ 3.2$
2012 52.2 3.1
2013 56.4 3.0
2014 59.5 2.9
2015 66.3 2.8
2016 to 2020 381.2 12.8
The accumulated benefit obligation for defined benefit pension plans was $986.7 and $895.7 at
September 30, 2010 and 2009, respectively. The following table shows pension plans with an
accumulated benefit obligation in excess of plan assets at the dates indicated.
September 30,
2010 2009
Projected benefit obligation 932.6$ 833.9$
Accumulated benefit obligation 891.7 807.8
Fair value of plan assets 641.3 596.8
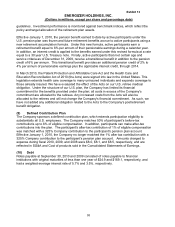
Pension plan assets in the U.S. plan represent 77% of assets in all of the Company’s defined
benefit pension plans. Investment policy for the U.S. plan includes a mandate to diversify assets
and invest in a variety of asset classes to achieve that goal. The U.S. plan's assets are currently
invested in several funds representing most standard equity and debt security classes. The
broad target allocations are: (a) equities, including U.S. and foreign: 60%, (b) debt securities,
U.S. bonds: 36% and (c) other: 4%. The U.S. plan held no shares of ENR stock at September
30, 2010. Investment objectives are similar for non-U.S. pension arrangements, subject to local
regulations.
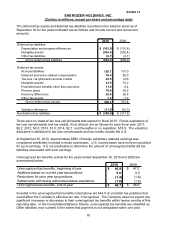
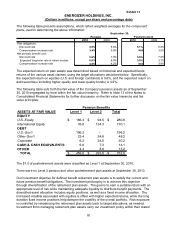
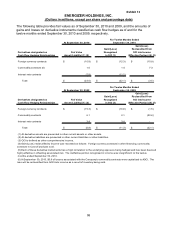
The following table presents pension and postretirement expense:
2010 2009 2008 2010 2009 2008
Service cost 32.7$ 31.7$ 33.9$ 0.5$ 0.4$ 0.4$
Interest cost 50.2 52.4 50.6 2.5 2.6 2.5
Expected return on plan assets (62.1) (60.7) (63.3) (0.1) - (0.1)
Amortization of unrecognized prior service cost (6.1) (2.9) (0.6) (2.7) (2.5) (2.1)
Amortization of unrecognized transition asset 0.2 0.4 0.5 - - -
Recognized net actuarial loss/(gain) 7.7 2.9 3.8 (1.5) (1.6) (2.1)
Settlement loss recognized - 3.2 - - - -
Net periodic benefit cost 22.6$ 27.0$ 24.9$ (1.3)$ (1.1)$ (1.4)$
Pension
For The Years Ended September 30,
Postretirement
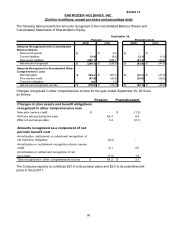
Amounts expected to be amortized from accumulated other comprehensive loss into net period
benefit cost during the year ending September 30, 2011, are as follows:
Pension Postretirement
Net actuarial (loss)/gain (14.9)$ 1.3$
Prior service credit 5.6 2.6
Initial net obligation (0.2) -