Energizer 2010 Annual Report Download - page 111
Download and view the complete annual report
Please find page 111 of the 2010 Energizer annual report below. You can navigate through the pages in the report by either clicking on the pages listed below, or by using the keyword search tool below to find specific information within the annual report.-
 1
1 -
2
-
3
-
4
-
5
-
6
-
7
-
8
-
9
-
10
-
11
-
12
-
13
-
14
-
15
-
16
-
17
-
18
-
19
-
20
-
21
-
22
-
23
-
24
-
25
-
26
-
27
-
28
-
29
-
30
-
31
-
32
-
33
-
34
-
35
-
36
-
37
-
38
-
39
-
40
-
41
-
42
-
43
-
44
-
45
-
46
-
47
-
48
-
49
-
50
-
51
-
52
-
53
-
54
-
55
-
56
-
57
-
58
-
59
-
60
-
61
-
62
-
63
-
64
-
65
-
66
-
67
-
68
-
69
-
70
-
71
-
72
-
73
-
74
-
75
-
76
-
77
-
78
-
79
-
80
-
81
-
82
-
83
-
84
-
85
-
86
-
87
-
88
-
89
-
90
-
91
-
92
-
93
-
94
-
95
-
96
-
97
-
98
-
99
-
100
-
 101
101 -
 102
102 -
 103
103 -
 104
104 -
 105
105 -
 106
106 -
 107
107 -
 108
108 -
 109
109 -
 110
110 -
 111
111 -
 112
112 -
 113
113 -
 114
114 -
 115
115 -
 116
116 -
 117
117 -
 118
118 -
 119
119 -
 120
120 -
 121
121 -
122
-
123
-
124
 |
 |

Exhibit 13
ENERGIZER HOLDINGS, INC.
(Dollars in millions, except per share and percentage data)
101
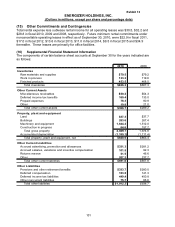
(15) Other Commitments and Contingencies
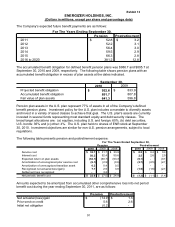
Total rental expense less sublease rental income for all operating leases was $30.5, $32.2 and
$28.8 in fiscal 2010, 2009 and 2008, respectively. Future minimum rental commitments under
noncancellable operating leases in effect as of September 30, 2010, were $22.9 in fiscal 2011,
$17.0 in fiscal 2012, $13.6 in fiscal 2013, $11.0 in fiscal 2014, $9.5 in fiscal 2015 and $34.9
thereafter. These leases are primarily for office facilities.
(16) Supplemental Financial Statement Information
The components of certain balance sheet accounts at September 30 for the years indicated are
as follows:
2010 2009
Inventories
Raw materials and supplies $79.5 $79.2
Work in process 133.3 119.6
Finished products 453.5 468.5
Total inventories $666.3 $667.3
Other Current Assets
Miscellaneous receivables $50.2 $54.3
Deferred income tax benefits 160.4 133.0
Prepaid expenses 78.3 80.9
Other 19.8 21.0
Total other current assets $308.7 $289.2
Property, plant and equipment
Land $37.3 $37.7
Buildings 283.6 267.4
Machinery and equipment 1,644.2 1,512.0
Construction in progress 64.6 157.7
Total gross property 2,029.7 1,974.8
Accumulated depreciation (1,189.1) (1,111.4)
Total property, plant and equipment, net $840.6 $863.4
Other Current Liabilities
Accrued advertising, promotion and allowances $331.3 $281.2
Accrued salaries, vacations and incentive compensation 101.5 92.3
Returns reserve 51.5 46.6
Other 207.3 237.7
Total other current liabilities $691.6 $657.8
Other Liabilities
Pensions and other retirement benefits $333.7 $280.0
Deferred compensation 153.5
141.3
Deferred income tax liabilities 449.4 450.8
Other noncurrent liabilities 75.7 66.6
Total other liabilities $1,012.3 $938.7