Energizer 2010 Annual Report Download - page 116
Download and view the complete annual report
Please find page 116 of the 2010 Energizer annual report below. You can navigate through the pages in the report by either clicking on the pages listed below, or by using the keyword search tool below to find specific information within the annual report.-
 1
1 -
2
-
3
-
4
-
5
-
6
-
7
-
8
-
9
-
10
-
11
-
12
-
13
-
14
-
15
-
16
-
17
-
18
-
19
-
20
-
21
-
22
-
23
-
24
-
25
-
26
-
27
-
28
-
29
-
30
-
31
-
32
-
33
-
34
-
35
-
36
-
37
-
38
-
39
-
40
-
41
-
42
-
43
-
44
-
45
-
46
-
47
-
48
-
49
-
50
-
51
-
52
-
53
-
54
-
55
-
56
-
57
-
58
-
59
-
60
-
61
-
62
-
63
-
64
-
65
-
66
-
67
-
68
-
69
-
70
-
71
-
72
-
73
-
74
-
75
-
76
-
77
-
78
-
79
-
80
-
81
-
82
-
83
-
84
-
85
-
86
-
87
-
88
-
89
-
90
-
91
-
92
-
93
-
94
-
95
-
96
-
97
-
98
-
99
-
100
-
101
-
102
-
103
-
104
-
105
-
 106
106 -
 107
107 -
 108
108 -
 109
109 -
 110
110 -
 111
111 -
 112
112 -
 113
113 -
 114
114 -
 115
115 -
 116
116 -
 117
117 -
 118
118 -
 119
119 -
 120
120 -
 121
121 -
 122
122 -
 123
123 -
 124
124
 |
 |

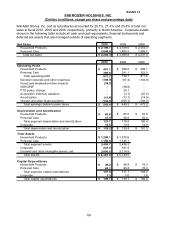
Exhibit 13
ENERGIZER HOLDINGS, INC.
(Dollars in millions, except per share and percentage data)
106
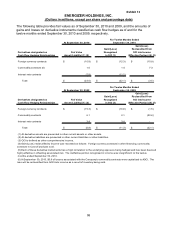
(18) Quarterly Financial Information – (Unaudited)
The results of any single quarter are not necessarily indicative of the Company’s results for the
full year. Net earnings of the Company are impacted in the first quarter by the additional battery
product sales volume associated with the December holiday season. Earnings per share data
are computed independently for each of the periods presented. As a result, the sum of the
earnings per share amounts for the quarter may not equal the total for the year.
First Second Third Fourth
Fiscal 2010
Net sales 1,176.7$ 935.1$ 1,076.8$ 1,059.7$
Gross profit 560.2 447.2 517.6 494.3
Net earnings 125.7 88.5 104.0 84.8
Basic earnings per share $1.80 $1.27 $1.48 $1.21
Diluted earnings per share $1.78 $1.25 $1.47 $1.20
Items increasing/(decreasing) net earnings:
Venezuela (25.5)$ 2.8$ 5.7$ 2.8$
VERO/Separation costs - - (0.1) 0.2
Integration costs (1.0) (0.6) (0.3) 0.1
Provisions for restructuring and related costs (3.5) (0.5) (0.5) (1.1)
Tax benefits - special foreign tax credit - - - 23.5
Adjustment to prior years tax accruals - - 3.7 2.4
First Second Third Fourth
Fiscal 2009
Net sales 1,042.5$ 880.4$ 997.5$ 1,079.4$
Gross profit 513.5 413.6 457.8 473.7
Net earnings 111.0 77.0 72.7 37.1
.
Basic earnings per share $1.90 $1.32 $1.15 $0.53
Diluted earnings per share $1.88 $1.30 $1.13 $0.53
Items increasing/(decreasing) net earnings:
PTO adjustment -$ 14.5$ 0.7$ -$
VERO/Separation costs - - - (24.3)
Acquisition inventory valuation - - - (2.3)
Integration costs (0.9) (1.1) - (1.1)
Provisions for restructuring and related costs (2.1) (3.1) (0.2) (0.4)
Adjustment to prior years tax accruals 0.9 0.1 (1.4) (1.1)
Earnings per share data are computed independently for each of the periods presented. As a
result, the sum of the earnings per share amounts for the quarters may not equal the total for the
year.
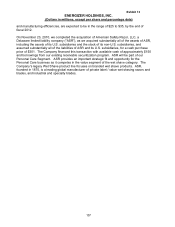
(19) Subsequent Events
On November 1, 2010, which is fiscal 2011, the Board of Directors (the “Board”) authorized a
Household Products multi-year program designed to accelerate investments in both geographic
and product growth opportunities, streamline our worldwide manufacturing operations and
improve the efficiency of our administrative operations. The Board authorized a broad
restructuring plan and has delegated authority to management to determine the final plan with
respect to the initiatives, which are expected to result in pre-tax charges in the range of $65 to
$85 over the next twelve months, with the vast majority associated with manufacturing capacity
rationalization. The remainder relates to overhead reductions. Although the specific actions to
be taken are not yet resolved, annual pre-tax savings, related primarily to headcount reduction