Energizer 2010 Annual Report Download - page 115
Download and view the complete annual report
Please find page 115 of the 2010 Energizer annual report below. You can navigate through the pages in the report by either clicking on the pages listed below, or by using the keyword search tool below to find specific information within the annual report.-
 1
1 -
2
-
3
-
4
-
5
-
6
-
7
-
8
-
9
-
10
-
11
-
12
-
13
-
14
-
15
-
16
-
17
-
18
-
19
-
20
-
21
-
22
-
23
-
24
-
25
-
26
-
27
-
28
-
29
-
30
-
31
-
32
-
33
-
34
-
35
-
36
-
37
-
38
-
39
-
40
-
41
-
42
-
43
-
44
-
45
-
46
-
47
-
48
-
49
-
50
-
51
-
52
-
53
-
54
-
55
-
56
-
57
-
58
-
59
-
60
-
61
-
62
-
63
-
64
-
65
-
66
-
67
-
68
-
69
-
70
-
71
-
72
-
73
-
74
-
75
-
76
-
77
-
78
-
79
-
80
-
81
-
82
-
83
-
84
-
85
-
86
-
87
-
88
-
89
-
90
-
91
-
92
-
93
-
94
-
95
-
96
-
97
-
98
-
99
-
100
-
101
-
102
-
103
-
104
-
 105
105 -
 106
106 -
 107
107 -
 108
108 -
 109
109 -
 110
110 -
 111
111 -
 112
112 -
 113
113 -
 114
114 -
 115
115 -
 116
116 -
 117
117 -
 118
118 -
 119
119 -
 120
120 -
 121
121 -
 122
122 -
 123
123 -
 124
124
 |
 |

Exhibit 13
ENERGIZER HOLDINGS, INC.
(Dollars in millions, except per share and percentage data)
105
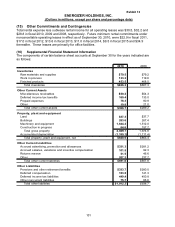
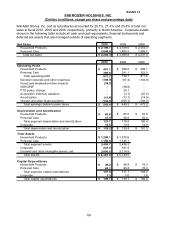
Geographic segment information on a legal entity basis:
2010 2009 2008
Net Sales to Customers
United States 2,196.8$ 2,100.1$ 2,207.8$
International 2,051.5 1,899.7 2,123.2
Total net sales 4,248.3$ 3,999.8$ 4,331.0$
Long-Lived Assets
United States 532.3$ 561.3$
Germany 106.2 128.7
Singapore 79.6 74.3
Other International 149.7 144.1
Total long-lived assets 867.8$ 908.4$
The Company’s international net sales are derived from customers in numerous countries, with
sales to customers in Canada representing 5.7%, 5.1% and 5.4% of the Company’s total net
sales in fiscal 2010, 2009 and 2008, respectively. Net sales to customers in all other single
foreign countries represented less than 5% of the Company’s total net sales for each of the three
years presented.
Supplemental product information is presented below for net sales:
2010 2009 2008
Net Sales
Alkaline batteries 1,327.9$ 1,264.3$ 1,490.1$
Other batteries and lighting products 871.8 845.2 984.2
Wet Shave 1,265.1 1,118.1 1,085.0
Skin Care 383.0 364.0 364.1
Feminine Care 198.8 214.1 222.6
Infant Care 201.7 194.1 185.0
Total net sales 4,248.3$ 3,999.8$ 4,331.0$