Energizer 2010 Annual Report Download - page 69
Download and view the complete annual report
Please find page 69 of the 2010 Energizer annual report below. You can navigate through the pages in the report by either clicking on the pages listed below, or by using the keyword search tool below to find specific information within the annual report.-
 1
1 -
2
-
3
-
4
-
5
-
6
-
7
-
8
-
9
-
10
-
11
-
12
-
13
-
14
-
15
-
16
-
17
-
18
-
19
-
20
-
21
-
22
-
23
-
24
-
25
-
26
-
27
-
28
-
29
-
30
-
31
-
32
-
33
-
34
-
35
-
36
-
37
-
38
-
39
-
40
-
41
-
42
-
43
-
44
-
45
-
46
-
47
-
48
-
49
-
50
-
51
-
52
-
53
-
54
-
55
-
56
-
57
-
58
-
 59
59 -
 60
60 -
 61
61 -
 62
62 -
 63
63 -
 64
64 -
 65
65 -
 66
66 -
 67
67 -
 68
68 -
 69
69 -
 70
70 -
 71
71 -
 72
72 -
 73
73 -
 74
74 -
 75
75 -
 76
76 -
 77
77 -
 78
78 -
 79
79 -
80
-
81
-
82
-
83
-
84
-
85
-
86
-
87
-
88
-
89
-
90
-
91
-
92
-
93
-
94
-
95
-
96
-
97
-
98
-
99
-
100
-
101
-
102
-
103
-
104
-
105
-
106
-
107
-
108
-
109
-
110
-
111
-
112
-
113
-
114
-
115
-
116
-
117
-
118
-
119
-
120
-
121
-
122
-
123
-
124
 |
 |

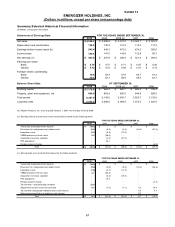
Exhibit 13
ENERGIZER HOLDINGS, INC.
(Dollars in millions, except per share and percentage data)
59
developments in Venezuela will affect our Venezuela operations, if at all. At September 30,
2010, the Company had approximately $22 in net monetary assets in Venezuela. Due to the
level of uncertainty in Venezuela, we cannot predict the exchange rate that will ultimately be
used to convert our local currency net monetary assets to U.S. dollars in the future.
Commodity Price Exposure
The Company uses raw materials that are subject to price volatility. At times, hedging
instruments are used by the Company to reduce exposure to variability in cash flows
associated with future purchases of zinc or other commodities. The fair market value of the
Company’s outstanding hedging instruments included in Accumulated other comprehensive
loss on the Consolidated Balance Sheets was an unrealized pre-tax gain of $1.0 and $6.1 at
September 30, 2010 and 2009, respectively. Over the next twelve months, approximately $0.3
of the loss included in Accumulated other comprehensive loss will be included in earnings.
Contract maturities for these hedges extend into fiscal year 2012. There were 14 open
contracts at September 30, 2010.
Interest Rate Exposure
At September 30, 2010 and 2009, the fair market value of the Company's fixed rate debt is
estimated at $2,077.5 and $1,926.2, respectively, using yields obtained from independent
pricing sources for similar types of borrowing arrangements. The fair value of debt is greater
than the carrying value of the Company's debt at September 30, 2010 by $242.5 and lower at
September 30,2009 by $3.8, respectively. A 10% decrease in interest rates on fixed-rate debt
would have increased the fair market value by $18.9 and $54.5 at September 30, 2010 and
2009, respectively. See Note 10 to the Consolidated Financial Statements for additional
information regarding the Company’s debt.
The Company has interest rate risk with respect to interest expense on variable rate debt. At
September 30, 2010, the Company had $478.4 of variable rate debt outstanding, of which $300
is hedged via interest rate swap agreements as disclosed below. As a result, after giving effect
to the hedged amount, a hypothetical one percentage point increase in variable interest rates
would have an annual unfavorable impact of approximately $2 on the Company’s earnings
before taxes and cash flows, based upon the current variable debt level at September 30,
2010.
During fiscal 2009, the Company entered into interest rate swap agreements with two major
financial institutions that fixed the variable benchmark component (LIBOR) of the Company’s
interest rate on $300 of the Company’s variable rate debt for the next two years at 1.9%.
These hedging instruments are considered cash flow hedges for accounting purposes. The
Company had an unrealized pre-tax loss on these interest rate swap agreements included in
Accumulated other comprehensive loss on the Consolidated Balance Sheets of $7.8 and a pre-
tax gain of $3.4 at September 30, 2010 and 2009, respectively.
Stock Price Exposure
At September 30, 2010, the Company held a share option with a major financial institution to
mitigate the impact of changes in certain of the Company’s deferred compensation liabilities,
which are tied to the Company’s common stock price. The fair market value of the share option
was $2.9 as included in other current liabilities and $2.0 as included in other current assets at
September 30, 2010 and 2009, respectively. The change in fair value of the total share option
for fiscal 2010 and 2009 resulted in income of $0.6 and expense of $3.0, respectively, and was
recorded in SG&A. Period activity related to the share option is classified in the same category