Energizer 2010 Annual Report Download - page 61
Download and view the complete annual report
Please find page 61 of the 2010 Energizer annual report below. You can navigate through the pages in the report by either clicking on the pages listed below, or by using the keyword search tool below to find specific information within the annual report.-
 1
1 -
2
-
3
-
4
-
5
-
6
-
7
-
8
-
9
-
10
-
11
-
12
-
13
-
14
-
15
-
16
-
17
-
18
-
19
-
20
-
21
-
22
-
23
-
24
-
25
-
26
-
27
-
28
-
29
-
30
-
31
-
32
-
33
-
34
-
35
-
36
-
37
-
38
-
39
-
40
-
41
-
42
-
43
-
44
-
45
-
46
-
47
-
48
-
49
-
50
-
 51
51 -
 52
52 -
 53
53 -
 54
54 -
 55
55 -
 56
56 -
 57
57 -
 58
58 -
 59
59 -
 60
60 -
 61
61 -
 62
62 -
 63
63 -
 64
64 -
 65
65 -
 66
66 -
 67
67 -
 68
68 -
 69
69 -
 70
70 -
 71
71 -
72
-
73
-
74
-
75
-
76
-
77
-
78
-
79
-
80
-
81
-
82
-
83
-
84
-
85
-
86
-
87
-
88
-
89
-
90
-
91
-
92
-
93
-
94
-
95
-
96
-
97
-
98
-
99
-
100
-
101
-
102
-
103
-
104
-
105
-
106
-
107
-
108
-
109
-
110
-
111
-
112
-
113
-
114
-
115
-
116
-
117
-
118
-
119
-
120
-
121
-
122
-
123
-
124
 |
 |

Exhibit 13
ENERGIZER HOLDINGS, INC.
(Dollars in millions, except per share and percentage data)
51
The Board of Directors authorized a broad restructuring plan and has delegated authority to
management to determine the final plan with respect to the initiatives, which are expected to
result in pre-tax charges in the range of $65 to $85 over the next twelve months, with the vast
majority associated with manufacturing capacity rationalization. The remainder relates to
overhead reductions. Although the specific actions to be taken are not yet resolved, annual
pre-tax savings, relating primarily to headcount reduction and manufacturing efficiencies, are
expected to be in the range of $25 to $35, by the end of fiscal 2012.
Looking forward and based on current market conditions, we expect the costs of commodities
and raw materials for the Household Products business in fiscal 2011 will be unfavorable in the
range of an estimated $20 to $30 as compared to the average costs paid in fiscal 2010 due
primarily to higher zinc and steel costs.
In regards to the impact of foreign currencies and based on current market conditions, we
expect currencies to be modestly favorable in fiscal 2011 to the average exchange rates for
fiscal 2010. This outlook is subject to considerable variation as market conditions change
during the year. While the Company utilizes certain hedging techniques, the percentage of
coverage for each currency will only partially hedge exchange rate variability.
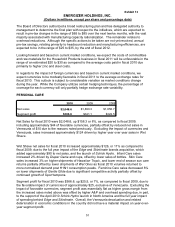
PERSONAL CARE
2010 2009 2008
Net sales $2,048.6 $1,890.3 $1,856.7
Segment profit $366.6 $341.1 $322.5
Net Sales for fiscal 2010 were $2,048.6, up $158.3 or 8%, as compared to fiscal 2009,
including approximately $44 of favorable currencies, partially offset by reduced net sales in
Venezuela of $10 due to the reasons noted previously. Excluding the impact of currencies and
Venezuela, sales increased approximately $124 driven by higher year over year sales in Wet
Shave.
Wet Shave net sales for fiscal 2010 increased approximately $126, or 11% as compared to
fiscal 2009, due to the full year impact of the Edge and Skintimate brands acquisition, which
added approximately $90 to net sales, and the launch of Schick Hydro. Infant Care sales
increased 2% driven by Diaper Genie and cups, offset by lower sales of bottles. Skin Care
sales increased 3% on higher shipments of Hawaiian Tropic, and lower end of season sun care
returns partially offset by lower shipments of Wet Ones as fiscal 2010 volumes returned to
more normalized demand post H1N1 consumption peaks. Feminine Care sales decreased 8%
on lower shipments of Gentle Glide due to significant competitive activity partially offset by
continued growth of Sport tampons.
Segment profit for fiscal 2010 was $366.6, up $25.5, or 7%, as compared to fiscal 2009, due to
the favorable impact of currencies of approximately $25, exclusive of Venezuela. Excluding the
impact of favorable currencies, segment profit was essentially flat as higher gross margin from
the increased sales noted above was offset by higher A&P and overhead spending due, in part,
to the support of the April 2010 Schick Hydro launch in North America and the full year impact
of spending behind Edge and Skintimate. Overall, the Venezuela devaluation and related
deterioration in economic conditions in the country did not have a material impact on year-over-
year segment profit.