Energizer 2010 Annual Report Download - page 64
Download and view the complete annual report
Please find page 64 of the 2010 Energizer annual report below. You can navigate through the pages in the report by either clicking on the pages listed below, or by using the keyword search tool below to find specific information within the annual report.
Exhibit 13
ENERGIZER HOLDINGS, INC.
(Dollars in millions, except per share and percentage data)
54
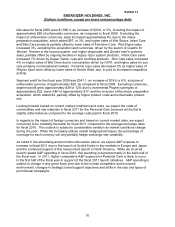
Liquidity and Capital Resources
At September 30, 2010, the Company had $629.7 in available cash and $259.7 available under
its committed debt facilities, exclusive of available borrowings under the receivables
securitization program.
On November 23, 2010, Energizer completed the acquisition of ASR for a cash purchase price
of $301. The Company financed this transaction with available cash of approximately $150
and borrowings from our existing receivables securitization program.
In May 2011, the Company’s $275 U.S. revolving credit facility will mature. At September 30,
2010, there were no outstanding borrowings under this facility. It is our intent to renew this
facility in advance of the May maturity date. However, we can provide no assurances that this
facility will be renewed, or if renewed, that the terms will be as favorable as those contained in
the existing facility.
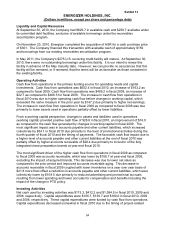
Operating Activities
Cash flow from operations is the primary funding source for operating needs and capital
investments. Cash flow from operations was $652.4 in fiscal 2010, an increase of $163.2 as
compared to fiscal 2009. Cash flow from operations was $489.2 in fiscal 2009, an increase of
$22.7 as compared to $466.5 for fiscal 2008. The increase in cash flow from operations in
fiscal 2010 was due to higher operating cash flow before changes in working capital, which
exceeded the same measure in the prior year by $147.2 due primarily to higher net earnings.
The increase in cash flow from operations in fiscal 2009 as compared to fiscal 2008 was due
primarily to lower assets used in operations partially offset by lower liabilities.
From a working capital perspective, changes in assets and liabilities used in operations
(working capital) provided positive cash flow of $26.8 in fiscal 2010, an improvement of $16.0
as compared to the cash flow generated by changes in working capital in fiscal 2009. The
most significant impact was in accounts payable and other current liabilities, which increased
collectively by $54.1 in fiscal 2010 due primarily to the level of promotional activities during the
fourth quarter of fiscal 2010 and the timing of payments. The favorable cash flow impact due to
a higher level of accounts payable and other current liabilities at the end of fiscal 2010 was
partially offset by higher accounts receivable of $26.4 due primarily to inclusion of the fully
integrated shave preparation brands at year-end fiscal 2010.
The most significant driver of the higher cash flow from operations in fiscal 2009 as compared
to fiscal 2008 was accounts receivable, which was lower by $106.7 at year-end fiscal 2009,
excluding the impact of acquired brands. This decrease was due to lower net sales as
compared to the prior period and improved accounts receivable aging. This decrease in
accounts receivable in fiscal 2009 coupled with lower inventories on a year over year basis of
$21.8 more than offset a reduction in accounts payable and other current liabilities, which were
collectively lower by $109.5 due primarily to reduced advertising and promotional accruals
resulting from lower spending and lower accruals for compensation and benefits including the
impact of the change in PTO policy.
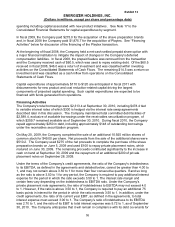
Investing Activities
Net cash used by investing activities was $113.3, $412.2 and $1,994.5 in fiscal 2010, 2009 and
2008, respectively. Capital expenditures were $108.7, $139.7 and $160.0 in fiscal 2010, 2009
and 2008, respectively. These capital expenditures were funded by cash flow from operations.
Capital expenditures decreased somewhat in fiscal 2010 due to the timing of project-related


