Energizer 2010 Annual Report Download - page 77
Download and view the complete annual report
Please find page 77 of the 2010 Energizer annual report below. You can navigate through the pages in the report by either clicking on the pages listed below, or by using the keyword search tool below to find specific information within the annual report.-
 1
1 -
2
-
3
-
4
-
5
-
6
-
7
-
8
-
9
-
10
-
11
-
12
-
13
-
14
-
15
-
16
-
17
-
18
-
19
-
20
-
21
-
22
-
23
-
24
-
25
-
26
-
27
-
28
-
29
-
30
-
31
-
32
-
33
-
34
-
35
-
36
-
37
-
38
-
39
-
40
-
41
-
42
-
43
-
44
-
45
-
46
-
47
-
48
-
49
-
50
-
51
-
52
-
53
-
54
-
55
-
56
-
57
-
58
-
59
-
60
-
61
-
62
-
63
-
64
-
65
-
66
-
 67
67 -
 68
68 -
 69
69 -
 70
70 -
 71
71 -
 72
72 -
 73
73 -
 74
74 -
 75
75 -
 76
76 -
 77
77 -
 78
78 -
 79
79 -
 80
80 -
 81
81 -
 82
82 -
 83
83 -
 84
84 -
 85
85 -
 86
86 -
 87
87 -
88
-
89
-
90
-
91
-
92
-
93
-
94
-
95
-
96
-
97
-
98
-
99
-
100
-
101
-
102
-
103
-
104
-
105
-
106
-
107
-
108
-
109
-
110
-
111
-
112
-
113
-
114
-
115
-
116
-
117
-
118
-
119
-
120
-
121
-
122
-
123
-
124
 |
 |

Exhibit 13
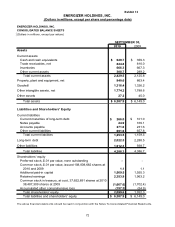
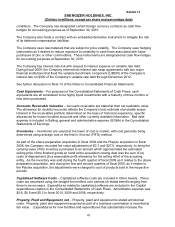
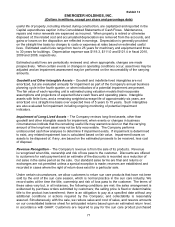
ENERGIZER HOLDINGS, INC.
(Dollars in millions, except per share and percentage data)
67
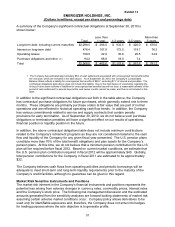
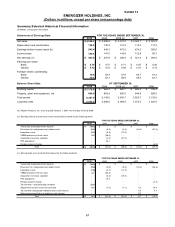
Summary Selected Historical Financial Information
(In millions, except per share data)
Statements of Earnings Data
2010 2009 2008 (a) 2007 2006
Net sales 4,248.3$ 3,999.8$ 4,331.0$ 3,365.1$ 3,076.9$
Depreciation and amortization 139.2 130.4 141.3 115.0 117.5
Earnings before income taxes (b) 543.4 445.3 473.2 434.2 356.6
Income taxes 140.4 147.5 143.9 112.8 95.7
Net earnings (c) 403.0$ 297.8$ 329.3$ 321.4$ 260.9$
Earnings per share:
Basic 5.76$ 4.77$ 5.71$ 5.67$ 4.26$
Diluted 5.72$ 4.72$ 5.59$ 5.51$ 4.14$
Average shares outstanding:
Basic 70.0 62.4 57.6 56.7 61.2
Diluted 70.5 63.1 58.9 58.3 63.1
Balance Sheet Data
2010 2009 2008 (a) 2007 2006
Working capital 1,176.0$ 966.3$ 665.1$ 888.5$ 708.2$
Property, plant and equipment, net 840.6 863.4 835.5 649.9 659.9
Total assets 6,387.9 6,149.0 5,816.7 3,525.7 3,132.6
Long-term debt 2,022.5 2,288.5 2,589.5 1,372.0 1,625.0
(a) Playtex Products, Inc. w as acquired October 1, 2007, the first day of fiscal 2008.
(b) Earnings bef ore income taxes w ere (reduced)/increased by the follow ing items:
2010 2009 2008 2007 2006
Venezuela devaluation/other impacts (18.3)$ -$ -$ -$ -$
Provisions for realignment and related costs (8.0) (8.8) (3.2) (18.2) (37.4)
Integration costs (3.0) (4.8) (17.9) - -
VERO/reduction in force costs 0.2 (38.6) - - -
Acquisition inventory valuation - (3.7) (27.5) - -
PTO adjustment - 24.1 - - -
Foreign pension charge - - - - (4.5)
Total (29.1)$ (31.8)$ (48.6)$ (18.2)$ (41.9)$
(c) Net earnings w ere (reduced)/increased by the follow ing items:
2010 2009 2008 2007 2006
Venezuela devaluation/other impacts (14.2)$ -$ -$ -$ -$
Provisions for realignment and related costs (5.6) (5.8) (2.0) (12.2) (24.9)
Integration costs (1.8) (3.1) (11.4) - -
VERO/reduction in force costs 0.1 (24.3) - - -
Acquisition inventory valuation - (2.3) (16.5) - -
PTO adjustment - 15.2 - - -
Foreign pension charge - - - - (3.7)
Tax benef its - special foreign dividend 23.5 - - - -
Adjustments to prior years tax accruals 6.1 (1.5) (1.1) 7.9 10.9
Tax benef its recognized related to prior years' losses - - - 4.3 5.7
Deferred tax benefit due to statutory rate change - - - 9.7 -
Total 8.1$ (21.8)$ (31.0)$ 9.7$ (12.0)$
AT SEPTEMBER 30,
FOR THE YEARS ENDED SEPTEMBER 30,
FOR THE YEARS ENDED SEPTEM BER 30,
FOR THE YEARS ENDED SEPTEM BER 30,