Energizer 2010 Annual Report Download - page 81
Download and view the complete annual report
Please find page 81 of the 2010 Energizer annual report below. You can navigate through the pages in the report by either clicking on the pages listed below, or by using the keyword search tool below to find specific information within the annual report.-
 1
1 -
2
-
3
-
4
-
5
-
6
-
7
-
8
-
9
-
10
-
11
-
12
-
13
-
14
-
15
-
16
-
17
-
18
-
19
-
20
-
21
-
22
-
23
-
24
-
25
-
26
-
27
-
28
-
29
-
30
-
31
-
32
-
33
-
34
-
35
-
36
-
37
-
38
-
39
-
40
-
41
-
42
-
43
-
44
-
45
-
46
-
47
-
48
-
49
-
50
-
51
-
52
-
53
-
54
-
55
-
56
-
57
-
58
-
59
-
60
-
61
-
62
-
63
-
64
-
65
-
66
-
67
-
68
-
69
-
70
-
 71
71 -
 72
72 -
 73
73 -
 74
74 -
 75
75 -
 76
76 -
 77
77 -
 78
78 -
 79
79 -
 80
80 -
 81
81 -
 82
82 -
 83
83 -
 84
84 -
 85
85 -
 86
86 -
 87
87 -
 88
88 -
 89
89 -
 90
90 -
 91
91 -
92
-
93
-
94
-
95
-
96
-
97
-
98
-
99
-
100
-
101
-
102
-
103
-
104
-
105
-
106
-
107
-
108
-
109
-
110
-
111
-
112
-
113
-
114
-
115
-
116
-
117
-
118
-
119
-
120
-
121
-
122
-
123
-
124
 |
 |

Exhibit 13
ENERGIZER HOLDINGS, INC.
(Dollars in millions, except per share and percentage data)
71
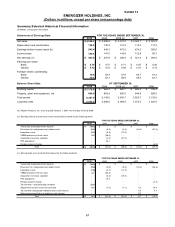
ENERGIZER HOLDINGS, INC.
CONSOLIDATED STATEMENTS OF EARNINGS AND COMPREHENSIVE INCOME
(Dollars in millions, except per share data)
Statement of Earnings 2010 2009 2008
Net sales 4,248.3$ 3,999.8$ 4,331.0$
Cost of products sold 2,229.0 2,141.2 2,293.3
Gross profit 2,019.3 1,858.6 2,037.7
Selling, general and administrative expense 765.7 742.6 794.0
Advertising and promotion expense 461.3 414.5 486.8
Research and development expense 97.1 90.5 91.7
Interest expense 125.4 144.7 181.3
Other financing expense, net 26.4 21.0 10.7
Earnings before income taxes 543.4 445.3 473.2
Income taxes 140.4 147.5 143.9
Net earnings 403.0$ 297.8$ 329.3$
Earnings Per Share
Basic net earnings per share 5.76$ 4.77$ 5.71$
Diluted net earnings per share 5.72$ 4.72$ 5.59$
Statement of Comprehensive Income
Net earnings 403.0$ 297.8$ 329.3$
Other comprehensive (loss)/income, net of tax
Foreign currency translation adjustments
(43.2) 12.7 3.8
Pension/postretirement activity, net of tax of $(19.8) in 2010,
(47.5) (78.6) (46.5)
$(45.9) in 2009 and $(17.8) in 2008
Deferred (loss)/gain on hedging activity, net of tax of $(6.9) in 2010,
(11.7) 3.1 3.8
$0.9 in 2009 and $1.7 in 2008
Comprehensive income 300.6$ 235.0$ 290.4$
The above financial statements should be read in conjunction w ith the Notes To Consolidated Financial Statements.
YEARS ENDED SEPTEMBER 30,