Energizer 2010 Annual Report Download - page 102
Download and view the complete annual report
Please find page 102 of the 2010 Energizer annual report below. You can navigate through the pages in the report by either clicking on the pages listed below, or by using the keyword search tool below to find specific information within the annual report.-
 1
1 -
2
-
3
-
4
-
5
-
6
-
7
-
8
-
9
-
10
-
11
-
12
-
13
-
14
-
15
-
16
-
17
-
18
-
19
-
20
-
21
-
22
-
23
-
24
-
25
-
26
-
27
-
28
-
29
-
30
-
31
-
32
-
33
-
34
-
35
-
36
-
37
-
38
-
39
-
40
-
41
-
42
-
43
-
44
-
45
-
46
-
47
-
48
-
49
-
50
-
51
-
52
-
53
-
54
-
55
-
56
-
57
-
58
-
59
-
60
-
61
-
62
-
63
-
64
-
65
-
66
-
67
-
68
-
69
-
70
-
71
-
72
-
73
-
74
-
75
-
76
-
77
-
78
-
79
-
80
-
81
-
82
-
83
-
84
-
85
-
86
-
87
-
88
-
89
-
90
-
91
-
 92
92 -
 93
93 -
 94
94 -
 95
95 -
 96
96 -
 97
97 -
 98
98 -
 99
99 -
 100
100 -
 101
101 -
 102
102 -
 103
103 -
 104
104 -
 105
105 -
 106
106 -
 107
107 -
 108
108 -
 109
109 -
 110
110 -
 111
111 -
 112
112 -
113
-
114
-
115
-
116
-
117
-
118
-
119
-
120
-
121
-
122
-
123
-
124
 |
 |

Exhibit 13
ENERGIZER HOLDINGS, INC.
(Dollars in millions, except per share and percentage data)
92
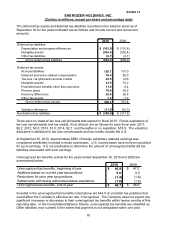
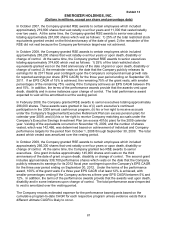
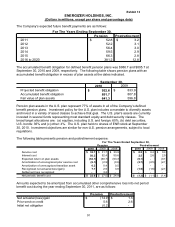
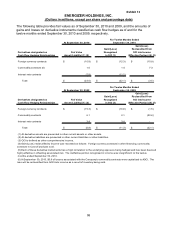
The following table presents assumptions, which reflect weighted-averages for the component
plans, used in determining the above information:
September 30,
Pension Postretirement
2010 2009 2010 2009
Plan obligations:
Discount rate 4.8% 5.6% 5.1% 5.9%
Compensation increase rate 3.4% 3.8% N/A 3.5%
Net periodic benefit cost:
Discount rate 5.6% 7.0% 5.9% 7.5%
8.0% 8.0% 3.5% 3.7%
Compensation increase rate 3.8% 4.2% N/A 3.9%
Expected long-term rate of return on plan
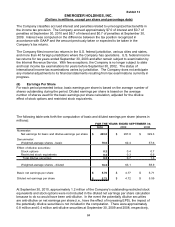
The expected return on plan assets was determined based on historical and expected future
returns of the various asset classes, using the target allocations described below. Specifically,
the expected return on equities (U.S. and foreign combined) is 9.6%, and the expected return on
debt securities (including higher-quality and lower-quality bonds) is 4.9%.
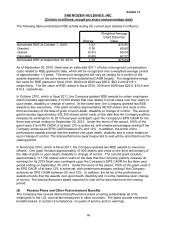
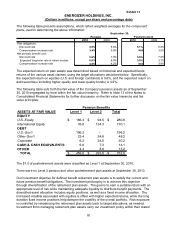
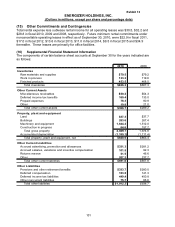
The following table sets forth the fair value of the Company’s pension assets as of September
30, 2010 segregated by level within the fair value hierarchy. Refer to Note 13 of the Notes to
Consolidated Financial Statements for further discussion on the fair value hierarchy and fair
value principles.
ASSETS AT FAIR VALUE Level 1 Level 2 Total
EQUITY
U.S. Equity 186.3$ 94.5$ 280.8$
International Equity 35.8 134.3 170.1
DEBT
U.S. Gov't 196.2 - 196.2
Other Gov't 23.4 24.8 48.2
Corporate 6.2 24.0 30.2
CASH & CASH EQUIVALENTS 6.8 7.3 14.1
OTHER 4.3 8.9 13.2
TOTAL 459.0$ 293.8$ 752.8$
Pension Benefits
The $1.0 of postretirement assets were classified as Level 1 at September 30, 2010.
There were no Level 3 pension and other postretirement plan assets at September 30, 2010.
Our investment objective for defined benefit retirement plan assets is to satisfy the current and
future pension benefit obligations. The investment philosophy is to achieve this objective
through diversification of the retirement plan assets. The goal is to earn a suitable return with an
appropriate level of risk while maintaining adequate liquidity to distribute benefit payments. The
diversified asset allocation includes equity positions, as well as a fixed income allocation. The
increased volatility associated with equities is offset with higher expected returns, while the long
duration fixed income positions help dampen the volatility of the overall portfolio. Risk exposure
is controlled by rebalancing the retirement plan assets back to target allocations, as needed.
Investment firms managing retirement plan assets carry out investment policy within their stated