Energizer 2010 Annual Report Download - page 114
Download and view the complete annual report
Please find page 114 of the 2010 Energizer annual report below. You can navigate through the pages in the report by either clicking on the pages listed below, or by using the keyword search tool below to find specific information within the annual report.-
 1
1 -
2
-
3
-
4
-
5
-
6
-
7
-
8
-
9
-
10
-
11
-
12
-
13
-
14
-
15
-
16
-
17
-
18
-
19
-
20
-
21
-
22
-
23
-
24
-
25
-
26
-
27
-
28
-
29
-
30
-
31
-
32
-
33
-
34
-
35
-
36
-
37
-
38
-
39
-
40
-
41
-
42
-
43
-
44
-
45
-
46
-
47
-
48
-
49
-
50
-
51
-
52
-
53
-
54
-
55
-
56
-
57
-
58
-
59
-
60
-
61
-
62
-
63
-
64
-
65
-
66
-
67
-
68
-
69
-
70
-
71
-
72
-
73
-
74
-
75
-
76
-
77
-
78
-
79
-
80
-
81
-
82
-
83
-
84
-
85
-
86
-
87
-
88
-
89
-
90
-
91
-
92
-
93
-
94
-
95
-
96
-
97
-
98
-
99
-
100
-
101
-
102
-
103
-
 104
104 -
 105
105 -
 106
106 -
 107
107 -
 108
108 -
 109
109 -
 110
110 -
 111
111 -
 112
112 -
 113
113 -
 114
114 -
 115
115 -
 116
116 -
 117
117 -
 118
118 -
 119
119 -
 120
120 -
 121
121 -
 122
122 -
 123
123 -
 124
124
 |
 |

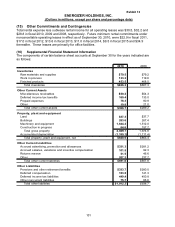
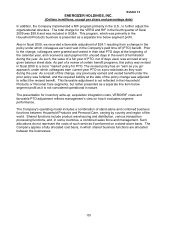
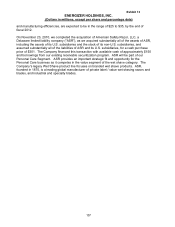
Exhibit 13
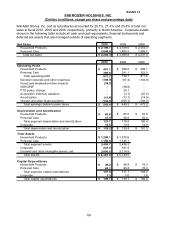
ENERGIZER HOLDINGS, INC.
(Dollars in millions, except per share and percentage data)
104
Wal-Mart Stores, Inc. and its subsidiaries accounted for 20.1%, 21.4% and 20.8% of total net
sales in fiscal 2010, 2009 and 2008, respectively, primarily in North America. Corporate assets
shown in the following table include all cash and cash equivalents, financial instruments and
deferred tax assets that are managed outside of operating segments.
Net Sales 2010 2009 2008
Household Products 2,199.7$ 2,109.5$ 2,474.3$
Personal Care 2,048.6 1,890.3 1,856.7
Total net sales 4,248.3$ 3,999.8$ 4,331.0$
2010 2009 2008
Operating Profit
Household Products 451.1$ 398.6$ 489.1$
Personal Care 366.6 341.1 322.5
Total operating profit 817.7 739.7 811.6
General corporate and other expenses (108.9) (97.4) (104.9)
Venezuela devaluation/other impacts (18.3) - -
VERO/RIF - (38.6) -
PTO policy change - 24.1 -
Acquisition inventory valuation - (3.7) (27.5)
Amortization (13.6) (13.1) (14.0)
Interest and other financing items (133.5) (165.7) (192.0)
Total earnings before income taxes 543.4$ 445.3$ 473.2$
Depreciation and Amortization
Household Products 65.8$ 65.6$ 67.0$
Personal Care 57.9 50.9 59.4
Total segment depreciation and amortization 123.7 116.5 126.4
Corporate 15.5 13.9 14.9
Total depreciation and amortization 139.2$ 130.4$ 141.3$
Total Assets
Household Products 1,299.1$ 1,370.6$
Personal Care 1,156.6 1,125.7
Total segment assets 2,455.7 2,496.3
Corporate 841.6 537.9
Goodwill and other intangible assets, net 3,090.6 3,114.8
Total assets 6,387.9$ 6,149.0$
Capital Expenditures
Household Products 38.2$ 56.9$ 79.3$
Personal Care 69.2 80.8 78.9
Total segment capital expenditures 107.4 137.7 158.2
Corporate 1.3 2.0 1.8
Total capital expenditures 108.7$ 139.7$ 160.0$