Energizer 2010 Annual Report Download - page 93
Download and view the complete annual report
Please find page 93 of the 2010 Energizer annual report below. You can navigate through the pages in the report by either clicking on the pages listed below, or by using the keyword search tool below to find specific information within the annual report.-
 1
1 -
2
-
3
-
4
-
5
-
6
-
7
-
8
-
9
-
10
-
11
-
12
-
13
-
14
-
15
-
16
-
17
-
18
-
19
-
20
-
21
-
22
-
23
-
24
-
25
-
26
-
27
-
28
-
29
-
30
-
31
-
32
-
33
-
34
-
35
-
36
-
37
-
38
-
39
-
40
-
41
-
42
-
43
-
44
-
45
-
46
-
47
-
48
-
49
-
50
-
51
-
52
-
53
-
54
-
55
-
56
-
57
-
58
-
59
-
60
-
61
-
62
-
63
-
64
-
65
-
66
-
67
-
68
-
69
-
70
-
71
-
72
-
73
-
74
-
75
-
76
-
77
-
78
-
79
-
80
-
81
-
82
-
 83
83 -
 84
84 -
 85
85 -
 86
86 -
 87
87 -
 88
88 -
 89
89 -
 90
90 -
 91
91 -
 92
92 -
 93
93 -
 94
94 -
 95
95 -
 96
96 -
 97
97 -
 98
98 -
 99
99 -
 100
100 -
 101
101 -
 102
102 -
 103
103 -
104
-
105
-
106
-
107
-
108
-
109
-
110
-
111
-
112
-
113
-
114
-
115
-
116
-
117
-
118
-
119
-
120
-
121
-
122
-
123
-
124
 |
 |

Exhibit 13
ENERGIZER HOLDINGS, INC.
(Dollars in millions, except per share and percentage data)
83
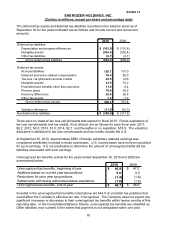
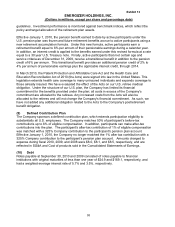
The deferred tax assets and deferred tax liabilities recorded on the balance sheet as of
September 30 for the years indicated are as follows and include current and noncurrent
amounts:
2010 2009
Deferred tax liabilities:
Depreciation and property differences (103.9)$ (101.8)$
Intangible assets (534.3) (532.4)
Other tax liabilities (6.1) (4.7)
Gross deferred tax liabilities (644.3) (638.9)
Deferred tax assets:
Accrued liabilities 120.7 101.0
Deferred and stock-related compensation 78.4 82.0
Tax loss carryforwards and tax credits 23.5 14.6
Intangible assets 21.9 31.2
Postretirement benefits other than pensions 11.0 6.4
Pension plans 79.4 63.2
Inventory differences 23.8 25.8
Other tax assets 7.6 7.2
Gross deferred tax assets 366.3 331.4
Valuation allowance (11.0) (10.3)
Net deferred tax liabilities (289.0)$ (317.8)$
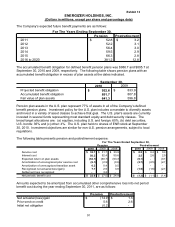
There were no material tax loss carryforwards that expired in fiscal 2010. Future expirations of
tax loss carryforwards and tax credits, if not utilized, are as follows for each fiscal year: 2011,
$0.2; 2012, $0.5; 2013, $1.9; 2014, $2.1; and thereafter or no expiration, $18.8. The valuation
allowance is attributed to tax loss carryforwards and tax credits outside the U.S.
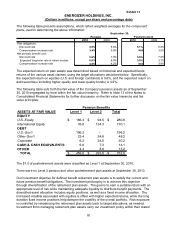
At September 30, 2010, approximately $960 of foreign subsidiary retained earnings was
considered indefinitely invested in those businesses. U.S. income taxes have not been provided
for such earnings. It is not practicable to determine the amount of unrecognized deferred tax
liabilities associated with such earnings.
Unrecognized tax benefits activity for the years ended September 30, 2010 and 2009 are
summarized below:
2010 2009
Unrecognized tax benefits, beginning of year $ 46.9 $ 47.0
Additions based on current year tax positions 5.0 3.3
Reductions for prior year tax positions (1.4) (1.6)
Settlements with taxing authorities/statute expirations (1.8) (1.8)
Unrecognized tax benefits, end of year $ 48.7 $ 46.9
Included in the unrecognized tax benefits noted above are $44.5 of uncertain tax positions that
would affect the Company’s effective tax rate, if recognized. The Company does not expect any
significant increases or decreases to their unrecognized tax benefits within twelve months of this
reporting date. In the Consolidated Balance Sheets, unrecognized tax benefits are classified as
Other liabilities (non-current) to the extent that payment is not anticipated within one year.