Energizer 2010 Annual Report Download - page 109
Download and view the complete annual report
Please find page 109 of the 2010 Energizer annual report below. You can navigate through the pages in the report by either clicking on the pages listed below, or by using the keyword search tool below to find specific information within the annual report.-
 1
1 -
2
-
3
-
4
-
5
-
6
-
7
-
8
-
9
-
10
-
11
-
12
-
13
-
14
-
15
-
16
-
17
-
18
-
19
-
20
-
21
-
22
-
23
-
24
-
25
-
26
-
27
-
28
-
29
-
30
-
31
-
32
-
33
-
34
-
35
-
36
-
37
-
38
-
39
-
40
-
41
-
42
-
43
-
44
-
45
-
46
-
47
-
48
-
49
-
50
-
51
-
52
-
53
-
54
-
55
-
56
-
57
-
58
-
59
-
60
-
61
-
62
-
63
-
64
-
65
-
66
-
67
-
68
-
69
-
70
-
71
-
72
-
73
-
74
-
75
-
76
-
77
-
78
-
79
-
80
-
81
-
82
-
83
-
84
-
85
-
86
-
87
-
88
-
89
-
90
-
91
-
92
-
93
-
94
-
95
-
96
-
97
-
98
-
 99
99 -
 100
100 -
 101
101 -
 102
102 -
 103
103 -
 104
104 -
 105
105 -
 106
106 -
 107
107 -
 108
108 -
 109
109 -
 110
110 -
 111
111 -
 112
112 -
 113
113 -
 114
114 -
 115
115 -
 116
116 -
 117
117 -
 118
118 -
 119
119 -
120
-
121
-
122
-
123
-
124
 |
 |

Exhibit 13
ENERGIZER HOLDINGS, INC.
(Dollars in millions, except per share and percentage data)
99
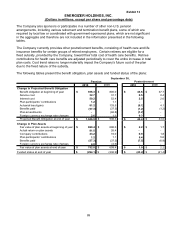
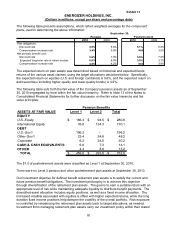
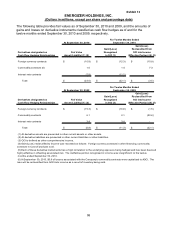
The following table provides fair values as of September 30, 2010 and 2009, and the amounts of
gains and losses on derivative instruments not classified as cash flow hedges as of and for the
twelve months ended September 30, 2010 and 2009, respectively.
For Twelve Months Ended
At September 30, 2010 September 30, 2010
Derivatives not designated as Fair Value Gain/(Loss) Income Statement
Cash Flow Hedging Relationships Asset (Liability) Recognized in Income Classification
Share option (2.9)$ 0.6$ SG&A
Foreign currency contracts 2.8 (5.4) Other financing
Total (0.1)$ (4.8)$
For Twelve Months Ended
At September 30, 2009 September 30, 2009
Derivatives not designated as Fair Value Gain/(Loss) Income Statement
Cash Flow Hedging Relationships Asset (Liability) Recognized in Income Classification
Share option 2.0$ (3.0)$ SG&A
Foreign currency contracts (1.0) (1.5) Other financing
Total 1.0$ (4.5)$
Fair Value Hierarchy Accounting guidance on fair value measurements for certain financial
assets and liabilities requires that assets and liabilities carried at fair value be classified in one of
the following three categories:
Level 1: Quoted market prices in active markets for identical assets or liabilities.
Level 2: Observable market based inputs or unobservable inputs that are corroborated by market
data.
Level 3: Unobservable inputs reflecting the reporting entity’s own assumptions or external inputs
from inactive markets.
Under the fair value accounting guidance hierarchy, an entity is required to maximize the use of
quoted market prices and minimize the use of unobservable inputs. The following table sets forth
the Company’s financial assets and liabilities, which are carried at fair value, as of September
30, 2010 and September 30, 2009 that are measured on a recurring basis during the period,
segregated by level within the fair value hierarchy:
2010 2009
Assets/(Liabilities) at fair value:
Deferred Compensation (136.4)$ (134.5)$
Derivatives - Foreign Exchange (14.0) (16.3)
Deri va t i ve s - Com m odi t y 1. 0 6.1
Derivatives - Interest Rate Swap (7.8) 3.4
Share Option (2.9) 2.0
Total Assets/(Liabilities) at fair value (160.1)$ (139.3)$
September 30,
Level 2