Delta Airlines 2015 Annual Report Download - page 99
Download and view the complete annual report
Please find page 99 of the 2015 Delta Airlines annual report below. You can navigate through the pages in the report by either clicking on the pages listed below, or by using the keyword search tool below to find specific information within the annual report.-
 1
1 -
2
-
3
-
4
-
5
-
6
-
7
-
8
-
9
-
10
-
11
-
12
-
13
-
14
-
15
-
16
-
17
-
18
-
19
-
20
-
21
-
22
-
23
-
24
-
25
-
26
-
27
-
28
-
29
-
30
-
31
-
32
-
33
-
34
-
35
-
36
-
37
-
38
-
39
-
40
-
41
-
42
-
43
-
44
-
45
-
46
-
47
-
48
-
49
-
50
-
51
-
52
-
53
-
54
-
55
-
56
-
57
-
58
-
59
-
60
-
61
-
62
-
63
-
64
-
65
-
66
-
67
-
68
-
69
-
70
-
71
-
72
-
73
-
74
-
75
-
76
-
77
-
78
-
79
-
80
-
81
-
82
-
83
-
84
-
85
-
86
-
87
-
88
-
 89
89 -
 90
90 -
 91
91 -
 92
92 -
 93
93 -
 94
94 -
 95
95 -
 96
96 -
 97
97 -
 98
98 -
 99
99 -
 100
100 -
 101
101 -
 102
102 -
 103
103 -
 104
104 -
 105
105 -
 106
106 -
 107
107 -
 108
108 -
 109
109 -
110
-
111
-
112
-
113
-
114
-
115
-
116
-
117
-
118
-
119
-
120
-
121
-
122
-
123
-
124
-
125
-
126
-
127
-
128
-
129
-
130
-
131
-
132
-
133
-
134
-
135
-
136
-
137
-
138
-
139
-
140
-
141
-
142
-
143
-
144
-
145
-
146
-
147
-
148
-
149
-
150
-
151
-
152
-
153
-
154
-
155
-
156
-
157
-
158
-
159
-
160
-
161
-
162
-
163
-
164
-
165
-
166
-
167
-
168
-
169
-
170
-
171
-
172
-
173
-
174
-
175
-
176
-
177
-
178
-
179
-
180
-
181
-
182
-
183
-
184
-
185
-
186
-
187
-
188
-
189
-
190
-
191
 |
 |

TableofContents
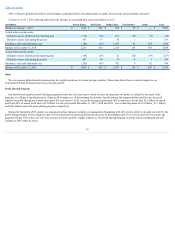
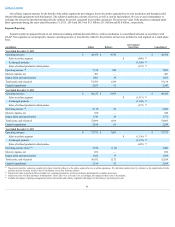
Thefollowingtableshowsthebalancesandactivityforrestructuringcharges:
SeveranceandRelatedCosts
LeaseRestructuring
(inmillions) 2015 2014 2013
2015 2014 2013
Liabilityatbeginningofperiod $ 42 $ — $ 49
$ 462 $ 168 $ 77
Additionalcostsandexpenses 51 71 —
41 349 114
Payments (41) (29) (46)
(86) (55) (18)
Other — — (3)
(2) — (5)
Liabilityatendofperiod $ 52 $ 42 $ —
$ 415 $ 462 $ 168
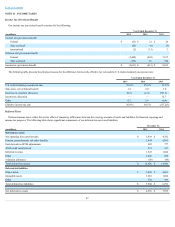
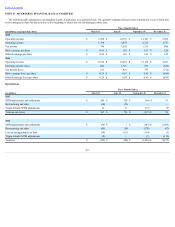
NOTE16.EARNINGSPERSHARE
Wecalculatebasicearningspersharebydividingthenetincomebytheweightedaveragenumberofcommonsharesoutstanding,excludingrestrictedshares.
Wecalculatedilutedearningspersharebydividingnetincomebytheweightedaveragenumberofcommonsharesoutstandingplusthedilutiveeffectof
outstandingshare-basedawards,includingstockoptionsandrestrictedstockawards.Antidilutivecommonstockequivalentsexcludedfromthedilutedearningsper
sharecalculationarenotmaterial.Thefollowingtableshowsourcomputationofbasicanddilutedearningspershare:
YearEndedDecember31,
(inmillions,exceptpersharedata) 2015 2014 2013
Netincome $ 4,526 $ 659 $ 10,540
Basicweightedaveragesharesoutstanding 797 836 849
Dilutiveeffectofshare-basedawards 7 9 9
Dilutedweightedaveragesharesoutstanding 804 845 858
Basicearningspershare $ 5.68 $ 0.79 $ 12.41
Dilutedearningspershare $ 5.63 $ 0.78 $ 12.29
93