Delta Airlines 2015 Annual Report Download - page 38
Download and view the complete annual report
Please find page 38 of the 2015 Delta Airlines annual report below. You can navigate through the pages in the report by either clicking on the pages listed below, or by using the keyword search tool below to find specific information within the annual report.-
 1
1 -
2
-
3
-
4
-
5
-
6
-
7
-
8
-
9
-
10
-
11
-
12
-
13
-
14
-
15
-
16
-
17
-
18
-
19
-
20
-
21
-
22
-
23
-
24
-
25
-
26
-
27
-
 28
28 -
 29
29 -
 30
30 -
 31
31 -
 32
32 -
 33
33 -
 34
34 -
 35
35 -
 36
36 -
 37
37 -
 38
38 -
 39
39 -
 40
40 -
 41
41 -
 42
42 -
 43
43 -
 44
44 -
 45
45 -
 46
46 -
 47
47 -
 48
48 -
49
-
50
-
51
-
52
-
53
-
54
-
55
-
56
-
57
-
58
-
59
-
60
-
61
-
62
-
63
-
64
-
65
-
66
-
67
-
68
-
69
-
70
-
71
-
72
-
73
-
74
-
75
-
76
-
77
-
78
-
79
-
80
-
81
-
82
-
83
-
84
-
85
-
86
-
87
-
88
-
89
-
90
-
91
-
92
-
93
-
94
-
95
-
96
-
97
-
98
-
99
-
100
-
101
-
102
-
103
-
104
-
105
-
106
-
107
-
108
-
109
-
110
-
111
-
112
-
113
-
114
-
115
-
116
-
117
-
118
-
119
-
120
-
121
-
122
-
123
-
124
-
125
-
126
-
127
-
128
-
129
-
130
-
131
-
132
-
133
-
134
-
135
-
136
-
137
-
138
-
139
-
140
-
141
-
142
-
143
-
144
-
145
-
146
-
147
-
148
-
149
-
150
-
151
-
152
-
153
-
154
-
155
-
156
-
157
-
158
-
159
-
160
-
161
-
162
-
163
-
164
-
165
-
166
-
167
-
168
-
169
-
170
-
171
-
172
-
173
-
174
-
175
-
176
-
177
-
178
-
179
-
180
-
181
-
182
-
183
-
184
-
185
-
186
-
187
-
188
-
189
-
190
-
191
 |
 |

TableofContents
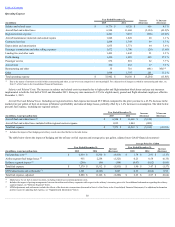
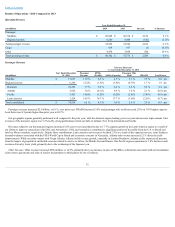
RegionalCarriersExpense.Thereductioninregionalcarriersexpenseisprimarilyduetolowerfuelexpensefrombothadecreaseinthecostoffuelpergallon
anda3.8%decreaseincapacityandfewerrequiredmaintenanceevents.During2014,weremovedthirty-five50-seatregionalaircraftfromourfleetaspartofour
strategytorestructureourdomesticfleet.
AircraftMaintenanceMaterialsandOutsideRepairs.Aircraftmaintenancematerialsandoutsiderepairsconsistsofcostsassociatedwithmaintenanceof
aircraftusedinouroperationsandcostsassociatedwithmaintenancesalestothirdpartiesbyourMROservicesbusiness.Thereductioninaircraftmaintenance
materialsandoutsiderepairsisdueprimarilytolowerenginemaintenancevolumeandacontractsettlementchargein2013,partiallyoffsetbyahighervolumeof
costofsalesfromourMRObusiness.
ContractedServices.Contractedservicesexpenseincreasedyear-over-yeardueprimarilytocostsassociatedwiththe3.0%increaseincapacity.
DepreciationandAmortization.Depreciationandamortizationexpenseincreasedyear-over-yearprimarilyduetoourinvestmentinnewB-737-900ERand
CRJ-900aircraft,thepurchaseofaircraftoff-leaseandaircraftmodificationsthatupgradedaircraftinteriorsandenhancedourproductoffering.
PassengerCommissionsandOtherSellingExpenses.Passengercommissionsandothersellingexpensesincreasedonhigherpassengerrevenue.
ProfitSharing.Theincreaseinprofitsharingisdrivenbyanincreaseinfullyearpre-taxincome,excludingprofitsharingandcertainotheritems,comparedto
theprioryear.
AircraftRent.Aircraftrentincreasedyear-over-yeardueprimarilytotheadditionofleasedB-717-200andB-737-900ERaircraftdeliveredduringtheyear,
partiallyoffsetbytheretirementofcertainB-747-400aircraft.
Other.Otheroperatingexpenseincreasedprimarilyduetocostsassociatedwithsalesofnon-jetfuelproductstothirdpartiesbyouroilrefinery.
34