Delta Airlines 2015 Annual Report Download - page 100
Download and view the complete annual report
Please find page 100 of the 2015 Delta Airlines annual report below. You can navigate through the pages in the report by either clicking on the pages listed below, or by using the keyword search tool below to find specific information within the annual report.-
 1
1 -
2
-
3
-
4
-
5
-
6
-
7
-
8
-
9
-
10
-
11
-
12
-
13
-
14
-
15
-
16
-
17
-
18
-
19
-
20
-
21
-
22
-
23
-
24
-
25
-
26
-
27
-
28
-
29
-
30
-
31
-
32
-
33
-
34
-
35
-
36
-
37
-
38
-
39
-
40
-
41
-
42
-
43
-
44
-
45
-
46
-
47
-
48
-
49
-
50
-
51
-
52
-
53
-
54
-
55
-
56
-
57
-
58
-
59
-
60
-
61
-
62
-
63
-
64
-
65
-
66
-
67
-
68
-
69
-
70
-
71
-
72
-
73
-
74
-
75
-
76
-
77
-
78
-
79
-
80
-
81
-
82
-
83
-
84
-
85
-
86
-
87
-
88
-
89
-
 90
90 -
 91
91 -
 92
92 -
 93
93 -
 94
94 -
 95
95 -
 96
96 -
 97
97 -
 98
98 -
 99
99 -
 100
100 -
 101
101 -
 102
102 -
 103
103 -
 104
104 -
 105
105 -
 106
106 -
 107
107 -
 108
108 -
 109
109 -
 110
110 -
111
-
112
-
113
-
114
-
115
-
116
-
117
-
118
-
119
-
120
-
121
-
122
-
123
-
124
-
125
-
126
-
127
-
128
-
129
-
130
-
131
-
132
-
133
-
134
-
135
-
136
-
137
-
138
-
139
-
140
-
141
-
142
-
143
-
144
-
145
-
146
-
147
-
148
-
149
-
150
-
151
-
152
-
153
-
154
-
155
-
156
-
157
-
158
-
159
-
160
-
161
-
162
-
163
-
164
-
165
-
166
-
167
-
168
-
169
-
170
-
171
-
172
-
173
-
174
-
175
-
176
-
177
-
178
-
179
-
180
-
181
-
182
-
183
-
184
-
185
-
186
-
187
-
188
-
189
-
190
-
191
 |
 |

TableofContents
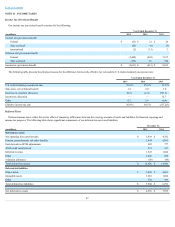
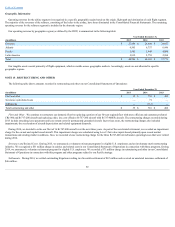
NOTE17.QUARTERLYFINANCIALDATA(UNAUDITED)
Thefollowingtablesummarizesourunauditedresultsofoperationsonaquarterlybasis.Thequarterlyearnings(loss)pershareamountsforayearwillnotadd
totheearningspershareforthatyearduetotheweightingofsharesusedincalculatingpersharedata.
ThreeMonthsEnded,
(inmillions,exceptpersharedata) March31 June30 September30 December31
2015
Operatingrevenue $ 9,388 $ 10,707 $ 11,107 $ 9,502
Operatingincome 1,398 2,474 2,213 1,717
Netincome 746 1,485 1,315 980
Basicearningspershare $ 0.91 $ 1.85 $ 1.67 $ 1.26
Dilutedearningspershare $ 0.90 $ 1.83 $ 1.65 $ 1.25
2014
Operatingrevenue $ 8,916 $ 10,621 $ 11,178 $ 9,647
Operatingincome(loss) 620 1,579 835 (828)
Netincome(loss) 213 801 357 (712)
Basicearnings(loss)pershare $ 0.25 $ 0.95 $ 0.43 $ (0.86)
Dilutedearnings(loss)pershare $ 0.25 $ 0.94 $ 0.42 $ (0.86)
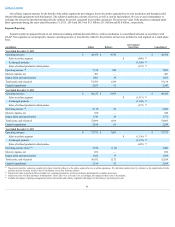
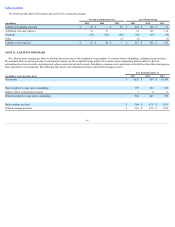
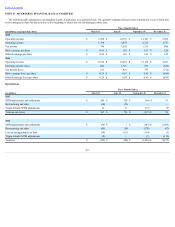
SpecialItems
ThreeMonthsEnded,
(inmillions) March31 June30 September30 December31
2015
MTMadjustmentsandsettlements $ 589 $ 720 $ (99) $ 91
Restructuringandother (10) (25) — —
VirginAtlanticMTMadjustments 13 31 (13) (5)
Totalincome(loss) $ 592 $ 726 $ (112) $ 86
2014
MTMadjustmentsandsettlements $ (34) $ 1 $ (347) $ (1,966)
Restructuringandother (49) (30) (570) (67)
Lossonextinguishmentofdebt (18) (111) (134) (5)
VirginAtlanticMTMadjustments (8) — (7) (119)
Totalloss $ (109) $ (140) $ (1,058) $ (2,157)
94