Delta Airlines 2015 Annual Report Download - page 28
Download and view the complete annual report
Please find page 28 of the 2015 Delta Airlines annual report below. You can navigate through the pages in the report by either clicking on the pages listed below, or by using the keyword search tool below to find specific information within the annual report.-
 1
1 -
2
-
3
-
4
-
5
-
6
-
7
-
8
-
9
-
10
-
11
-
12
-
13
-
14
-
15
-
16
-
17
-
 18
18 -
 19
19 -
 20
20 -
 21
21 -
 22
22 -
 23
23 -
 24
24 -
 25
25 -
 26
26 -
 27
27 -
 28
28 -
 29
29 -
 30
30 -
 31
31 -
 32
32 -
 33
33 -
 34
34 -
 35
35 -
 36
36 -
 37
37 -
 38
38 -
39
-
40
-
41
-
42
-
43
-
44
-
45
-
46
-
47
-
48
-
49
-
50
-
51
-
52
-
53
-
54
-
55
-
56
-
57
-
58
-
59
-
60
-
61
-
62
-
63
-
64
-
65
-
66
-
67
-
68
-
69
-
70
-
71
-
72
-
73
-
74
-
75
-
76
-
77
-
78
-
79
-
80
-
81
-
82
-
83
-
84
-
85
-
86
-
87
-
88
-
89
-
90
-
91
-
92
-
93
-
94
-
95
-
96
-
97
-
98
-
99
-
100
-
101
-
102
-
103
-
104
-
105
-
106
-
107
-
108
-
109
-
110
-
111
-
112
-
113
-
114
-
115
-
116
-
117
-
118
-
119
-
120
-
121
-
122
-
123
-
124
-
125
-
126
-
127
-
128
-
129
-
130
-
131
-
132
-
133
-
134
-
135
-
136
-
137
-
138
-
139
-
140
-
141
-
142
-
143
-
144
-
145
-
146
-
147
-
148
-
149
-
150
-
151
-
152
-
153
-
154
-
155
-
156
-
157
-
158
-
159
-
160
-
161
-
162
-
163
-
164
-
165
-
166
-
167
-
168
-
169
-
170
-
171
-
172
-
173
-
174
-
175
-
176
-
177
-
178
-
179
-
180
-
181
-
182
-
183
-
184
-
185
-
186
-
187
-
188
-
189
-
190
-
191
 |
 |
TableofContents
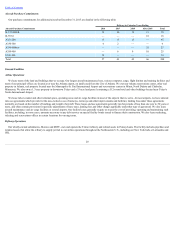
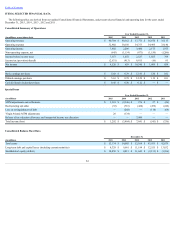
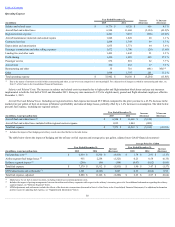
ITEM6.SELECTEDFINANCIALDATA
ThefollowingtablesarederivedfromourauditedConsolidatedFinancialStatements,andpresentselectedfinancialandoperatingdatafortheyearsended
December31,2015,2014,2013,2012and2011.
ConsolidatedSummaryofOperations
YearEndedDecember31,
(inmillions,exceptsharedata) 2015 2014 2013 2012 2011
Operatingrevenue $ 40,704 $ 40,362 $ 37,773 $ 36,670 $ 35,115
Operatingexpense 32,902 38,156 34,373 34,495 33,140
Operatingincome 7,802 2,206 3,400 2,175 1,975
Non-operatingexpense,net (645) (1,134) (873) (1,150) (1,206)
Incomebeforeincometaxes 7,157 1,072 2,527 1,025 769
Incometax(provision)benefit (2,631) (413) 8,013 (16) 85
Netincome $ 4,526 $ 659 $ 10,540 $ 1,009 $ 854
Basicearningspershare $ 5.68 $ 0.79 $ 12.41 $ 1.20 $ 1.02
Dilutedearningspershare $ 5.63 $ 0.78 $ 12.29 $ 1.19 $ 1.01
Cashdividendsdeclaredpershare $ 0.45 $ 0.30 $ 0.12 $ — $ —
SpecialItems
YearEndedDecember31,
(inmillions) 2015 2014 2013 2012 2011
MTMadjustmentsandsettlements $ 1,301 $ (2,346) $ 276 $ 27 $ (26)
Restructuringandother (35) (716) (424) (452) (242)
Lossonextinguishmentofdebt — (268) — (118) (68)
VirginAtlanticMTMadjustments 26 (134) — — —
Releaseoftaxvaluationallowanceandintraperiodincometaxallocation — — 7,989 — —
Totalincome(loss) $ 1,292 $ (3,464) $ 7,841 $ (543) $ (336)
ConsolidatedBalanceSheetData
December31,
(inmillions) 2015 2014 2013 2012 2011
Totalassets $ 53,134 $ 54,005 $ 52,104 $ 43,933 $ 42,879
Long-termdebtandcapitalleases(includingcurrentmaturities) $ 8,329 $ 9,661 $ 11,194 $ 12,555 $ 13,632
Stockholders'equity(deficit) $ 10,850 $ 8,813 $ 11,643 $ (2,131) $ (1,396)
24