Delta Airlines 2015 Annual Report Download - page 34
Download and view the complete annual report
Please find page 34 of the 2015 Delta Airlines annual report below. You can navigate through the pages in the report by either clicking on the pages listed below, or by using the keyword search tool below to find specific information within the annual report.-
 1
1 -
2
-
3
-
4
-
5
-
6
-
7
-
8
-
9
-
10
-
11
-
12
-
13
-
14
-
15
-
16
-
17
-
18
-
19
-
20
-
21
-
22
-
23
-
 24
24 -
 25
25 -
 26
26 -
 27
27 -
 28
28 -
 29
29 -
 30
30 -
 31
31 -
 32
32 -
 33
33 -
 34
34 -
 35
35 -
 36
36 -
 37
37 -
 38
38 -
 39
39 -
 40
40 -
 41
41 -
 42
42 -
 43
43 -
 44
44 -
45
-
46
-
47
-
48
-
49
-
50
-
51
-
52
-
53
-
54
-
55
-
56
-
57
-
58
-
59
-
60
-
61
-
62
-
63
-
64
-
65
-
66
-
67
-
68
-
69
-
70
-
71
-
72
-
73
-
74
-
75
-
76
-
77
-
78
-
79
-
80
-
81
-
82
-
83
-
84
-
85
-
86
-
87
-
88
-
89
-
90
-
91
-
92
-
93
-
94
-
95
-
96
-
97
-
98
-
99
-
100
-
101
-
102
-
103
-
104
-
105
-
106
-
107
-
108
-
109
-
110
-
111
-
112
-
113
-
114
-
115
-
116
-
117
-
118
-
119
-
120
-
121
-
122
-
123
-
124
-
125
-
126
-
127
-
128
-
129
-
130
-
131
-
132
-
133
-
134
-
135
-
136
-
137
-
138
-
139
-
140
-
141
-
142
-
143
-
144
-
145
-
146
-
147
-
148
-
149
-
150
-
151
-
152
-
153
-
154
-
155
-
156
-
157
-
158
-
159
-
160
-
161
-
162
-
163
-
164
-
165
-
166
-
167
-
168
-
169
-
170
-
171
-
172
-
173
-
174
-
175
-
176
-
177
-
178
-
179
-
180
-
181
-
182
-
183
-
184
-
185
-
186
-
187
-
188
-
189
-
190
-
191
 |
 |

TableofContents
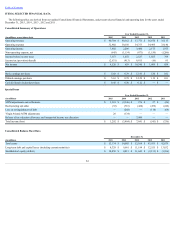
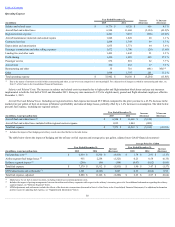
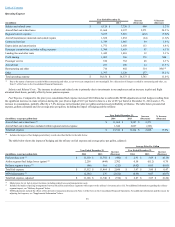
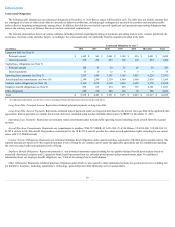
Operating Expense
YearEndedDecember31, Increase
(Decrease)
%Increase
(Decrease)(inmillions) 2015 2014
Salariesandrelatedcosts $ 8,776 $ 8,120 $ 656 8.1%
Aircraftfuelandrelatedtaxes 6,544 11,668 (5,124) (43.9)%
Regionalcarriersexpense 4,241 5,237 (996) (19.0)%
Aircraftmaintenancematerialsandoutsiderepairs 1,848 1,828 20 1.1%
Contractedservices 1,848 1,749 99 5.7%
Depreciationandamortization 1,835 1,771 64 3.6%
Passengercommissionsandothersellingexpenses 1,672 1,700 (28) (1.6)%
Landingfeesandotherrents 1,493 1,442 51 3.5%
Profitsharing 1,490 1,085 405 37.3%
Passengerservice 872 810 62 7.7%
Aircraftrent 250 233 17 7.3%
Restructuringandother 35 716 (681) NM(1)
Other 1,998 1,797 201 11.2%
Totaloperatingexpense $ 32,902 $ 38,156 $ (5,254) (13.8)%
(1) Duetothenatureofamountsrecordedwithinrestructuringandother,ayear-over-yearcomparisonisnotmeaningful.Foradiscussionofchargesrecordedinrestructuringandother,see
Note15oftheNotestotheConsolidatedFinancialStatements.
SalariesandRelatedCosts.Theincreaseinsalariesandrelatedcostsisprimarilyduetohigherpilotandflightattendantblockhoursandpayrateincreases
implementedinboththefirsthalfof2015andDecember2015.Basepayratesincreased14.5%foreligiblemerit,groundandflightattendantemployeeseffective
December1,2015.
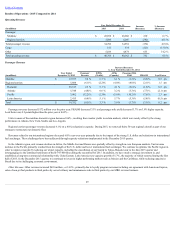
AircraftFuelandRelatedTaxes.Includingourregionalcarriers,fuelexpensedecreased$5.9billioncomparedtotheprioryearduetoa43.5%decreaseinthe
marketpricepergallonoffuel,anincreaseinMonroe'sprofitabilityandreducedhedgelosses,partiallyoffsetbya2.4%increaseinconsumption.Thetablebelow
presentsfuelexpense,includingourregionalcarriers:
YearEndedDecember31, Increase
(Decrease)
%Increase
(Decrease)(inmillions,exceptpergallondata) 2015 2014
Aircraftfuelandrelatedtaxes(1) $ 6,544 $ 11,668 $ (5,124)
Aircraftfuelandrelatedtaxesincludedwithinregionalcarriersexpense 1,035 1,844 (809)
Totalfuelexpense $ 7,579 $ 13,512 $ (5,933) (43.9)%
(1) Includestheimpactoffuelhedgingandrefineryresultsdescribedfurtherinthetablebelow.
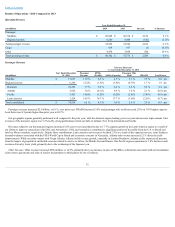
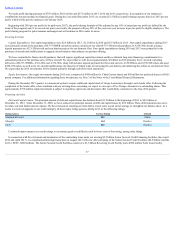
Thetablebelowshowstheimpactofhedgingandtherefineryonfuelexpenseandaveragepricepergallon,adjusted(non-GAAPfinancialmeasures):
AveragePricePerGallon
YearEndedDecember31, Increase
(Decrease)
YearEndedDecember31, Increase
(Decrease)(inmillions,exceptpergallondata) 2015 2014
2015 2014
Fuelpurchasecost(1) $ 6,934 $ 11,350 $ (4,416)
$ 1.74 $ 2.91 $ (1.17)
Airlinesegmentfuelhedgelosses(2) 935 2,258 (1,323)
0.23 0.58 (0.35)
Refinerysegmentimpact(2) (290) (96) (194)
(0.07) (0.02) (0.05)
Totalfuelexpense $ 7,579 $ 13,512 $ (5,933)
$ 1.90 $ 3.47 $ (1.57)
MTMadjustmentsandsettlements(3) 1,301 (2,346) 3,647
0.33 (0.60) 0.93
Totalfuelexpense,adjusted $ 8,880 $ 11,166 $ (2,286)
$ 2.23 $ 2.87 $ (0.64)
(1) Marketpriceforjetfuelatairportlocations,includingrelatedtaxesandtransportationcosts.
(2) Includestheimpactofpricingarrangementsbetweentheairlineandrefinerysegmentswithrespecttotherefinery'sinventorypricerisk.Foradditionalinformationregardingtherefinery
segmentimpact,see"RefinerySegment"below.
(3) MTMadjustmentsandsettlementsincludetheeffectsofthederivativetransactionsdiscussedinNote4oftheNotestotheConsolidatedFinancialStatements.Foradditionalinformation
andthereasonforadjustingfuelexpense,see"SupplementalInformation"below.
30