Delta Airlines 2015 Annual Report Download - page 87
Download and view the complete annual report
Please find page 87 of the 2015 Delta Airlines annual report below. You can navigate through the pages in the report by either clicking on the pages listed below, or by using the keyword search tool below to find specific information within the annual report.-
 1
1 -
2
-
3
-
4
-
5
-
6
-
7
-
8
-
9
-
10
-
11
-
12
-
13
-
14
-
15
-
16
-
17
-
18
-
19
-
20
-
21
-
22
-
23
-
24
-
25
-
26
-
27
-
28
-
29
-
30
-
31
-
32
-
33
-
34
-
35
-
36
-
37
-
38
-
39
-
40
-
41
-
42
-
43
-
44
-
45
-
46
-
47
-
48
-
49
-
50
-
51
-
52
-
53
-
54
-
55
-
56
-
57
-
58
-
59
-
60
-
61
-
62
-
63
-
64
-
65
-
66
-
67
-
68
-
69
-
70
-
71
-
72
-
73
-
74
-
75
-
76
-
 77
77 -
 78
78 -
 79
79 -
 80
80 -
 81
81 -
 82
82 -
 83
83 -
 84
84 -
 85
85 -
 86
86 -
 87
87 -
 88
88 -
 89
89 -
 90
90 -
 91
91 -
 92
92 -
 93
93 -
 94
94 -
 95
95 -
 96
96 -
 97
97 -
98
-
99
-
100
-
101
-
102
-
103
-
104
-
105
-
106
-
107
-
108
-
109
-
110
-
111
-
112
-
113
-
114
-
115
-
116
-
117
-
118
-
119
-
120
-
121
-
122
-
123
-
124
-
125
-
126
-
127
-
128
-
129
-
130
-
131
-
132
-
133
-
134
-
135
-
136
-
137
-
138
-
139
-
140
-
141
-
142
-
143
-
144
-
145
-
146
-
147
-
148
-
149
-
150
-
151
-
152
-
153
-
154
-
155
-
156
-
157
-
158
-
159
-
160
-
161
-
162
-
163
-
164
-
165
-
166
-
167
-
168
-
169
-
170
-
171
-
172
-
173
-
174
-
175
-
176
-
177
-
178
-
179
-
180
-
181
-
182
-
183
-
184
-
185
-
186
-
187
-
188
-
189
-
190
-
191
 |
 |

TableofContents
ExpectedLong-TermRateofReturn.Ourexpectedlong-termrateofreturnonplanassetsisbasedprimarilyonplan-specificinvestmentstudiesusinghistorical
marketreturnandvolatilitydata.Modestexcessreturnexpectationsversussomepublicmarketindicesareincorporatedintothereturnprojectionsbasedonthe
activelymanagedstructureoftheinvestmentprogramsandtheirrecordsofachievingsuchreturnshistorically.Wealsoexpecttoreceiveapremiumforinvesting
inlessliquidprivatemarkets.Wereviewourrateofreturnonplanassetsassumptionsannually.Ourannualinvestmentperformanceforoneparticularyeardoes
not,byitself,significantlyinfluenceourevaluation.Theinvestmentstrategyforourdefinedbenefitpensionplanassetsistoearnalong-termreturnthatmeetsor
exceedsourannualizedreturntargetwhiletakinganacceptablelevelofriskandmaintainingsufficientliquiditytopaycurrentbenefitsandothercashobligations
oftheplan.Thisisachievedbyinvestinginagloballydiversifiedmixofpublicandprivateequity,fixedincome,realassets,hedgefundsandotherassetsand
instruments.Ourexpectedlong-termrateofreturnonassetsfornetperiodicpensionbenefitcostfortheyearendedDecember31,2015was9%.
LifeExpectancy.WehavehistoricallyutilizedtheSocietyofActuaries'("SOA")publishedmortalitydataindevelopingabestestimateoflifeexpectancy.
During2014,theSOApublishedupdatedmortalitytablesforU.S.plansandanupdatedimprovementscale,whichbothreflectimprovedlongevity.Basedonan
evaluationofthesenewtablesandourperspectiveoffuturelongevity,weupdatedthemortalityassumptionsin2014forpurposesofmeasuringpensionandother
postretirementandpostemploymentbenefitobligations.Theimprovementinlifeexpectancyincreasesourbenefitobligationsandfutureexpenseasbenefit
paymentsarepaidoveranextendedperiodoftime.In2015,wereviewedthemortalityassumptionsandconcludedthattheassumptionsusedin2014continueto
representourbestestimateoflong-termlifeexpectancy.Wewillcontinuetoreviewourassumptionsonanannualbasis.
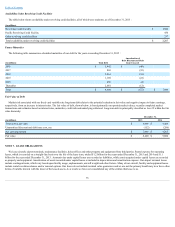
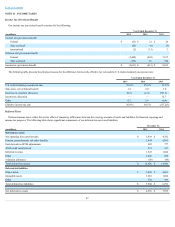
Benefit Payments
Benefitpaymentsinthetablebelowarebasedonthesameassumptionsusedtomeasuretherelatedbenefitobligations.Actualbenefitpaymentsmayvary
significantlyfromtheseestimates.Benefitsearnedunderourpensionplansandcertainpostemploymentbenefitplansareexpectedtobepaidfromfundedbenefit
plantrusts,whileourotherpostretirementbenefitsarefundedfromcurrentassets.
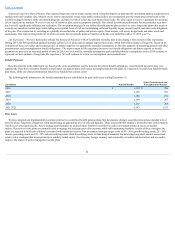
Thefollowingtablesummarizes,thebenefitpaymentsthatarescheduledtobepaidintheyearsendingDecember31:
(inmillions) PensionBenefits
OtherPostretirementand
PostemploymentBenefits
2016 $ 1,154 $ 286
2017 1,158 281
2018 1,180 271
2019 1,199 267
2020 1,219 268
2021-2025 6,343 1,335
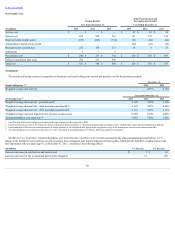
Plan Assets
Wehaveadoptedandimplementedinvestmentpoliciesforourdefinedbenefitpensionplansthatincorporatestrategicassetallocationmixesintendedtobest
meettheplans’long-termobligations,whilemaintaininganappropriatelevelofriskandliquidity.Theseassetportfoliosemployadiversifiedmixofinvestments,
whicharereviewedperiodically.Activemanagementstrategiesareutilizedwherefeasibleinanefforttorealizeinvestmentreturnsinexcessofmarket
indices.Derivativesintheplansareprimarilyusedtomanageriskandgainassetclassexposurewhilestillmaintainingliquidity.Aspartofthesestrategies,the
plansarerequiredtoholdcashcollateralassociatedwithcertainderivatives.Ourinvestmentstrategiestargetamixof40-50%growth-seekingassets,20-30%
income-generatingassetsand25-30%risk-diversifyingassets.Riskdiversifyingassetsincludehedgedmandatesimplementinglong-short,marketneutraland
relativevaluestrategiesthatinvestprimarilyinpublicly-tradedequity,fixedincome,foreigncurrencyandcommoditysecuritiesandderivativesandareusedto
improvetheimpactofactivemanagementontheplans.
81