Delta Airlines 2015 Annual Report Download - page 36
Download and view the complete annual report
Please find page 36 of the 2015 Delta Airlines annual report below. You can navigate through the pages in the report by either clicking on the pages listed below, or by using the keyword search tool below to find specific information within the annual report.-
 1
1 -
2
-
3
-
4
-
5
-
6
-
7
-
8
-
9
-
10
-
11
-
12
-
13
-
14
-
15
-
16
-
17
-
18
-
19
-
20
-
21
-
22
-
23
-
24
-
25
-
 26
26 -
 27
27 -
 28
28 -
 29
29 -
 30
30 -
 31
31 -
 32
32 -
 33
33 -
 34
34 -
 35
35 -
 36
36 -
 37
37 -
 38
38 -
 39
39 -
 40
40 -
 41
41 -
 42
42 -
 43
43 -
 44
44 -
 45
45 -
 46
46 -
47
-
48
-
49
-
50
-
51
-
52
-
53
-
54
-
55
-
56
-
57
-
58
-
59
-
60
-
61
-
62
-
63
-
64
-
65
-
66
-
67
-
68
-
69
-
70
-
71
-
72
-
73
-
74
-
75
-
76
-
77
-
78
-
79
-
80
-
81
-
82
-
83
-
84
-
85
-
86
-
87
-
88
-
89
-
90
-
91
-
92
-
93
-
94
-
95
-
96
-
97
-
98
-
99
-
100
-
101
-
102
-
103
-
104
-
105
-
106
-
107
-
108
-
109
-
110
-
111
-
112
-
113
-
114
-
115
-
116
-
117
-
118
-
119
-
120
-
121
-
122
-
123
-
124
-
125
-
126
-
127
-
128
-
129
-
130
-
131
-
132
-
133
-
134
-
135
-
136
-
137
-
138
-
139
-
140
-
141
-
142
-
143
-
144
-
145
-
146
-
147
-
148
-
149
-
150
-
151
-
152
-
153
-
154
-
155
-
156
-
157
-
158
-
159
-
160
-
161
-
162
-
163
-
164
-
165
-
166
-
167
-
168
-
169
-
170
-
171
-
172
-
173
-
174
-
175
-
176
-
177
-
178
-
179
-
180
-
181
-
182
-
183
-
184
-
185
-
186
-
187
-
188
-
189
-
190
-
191
 |
 |

TableofContents
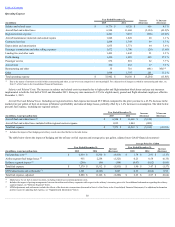
ResultsofOperations-2014Comparedto2013
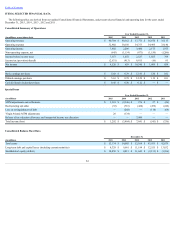
Operating Revenue
YearEndedDecember31,
Increase %Increase(inmillions) 2014 2013
Passenger:
Mainline $ 28,688 $ 26,534 $ 2,154 8.1%
Regionalcarriers 6,266 6,408 (142) (2.2)%
Totalpassengerrevenue 34,954 32,942 2,012 6.1%
Cargo 934 937 (3) (0.3)%
Other 4,474 3,894 580 14.9%
Totaloperatingrevenue $ 40,362 $ 37,773 $ 2,589 6.9%
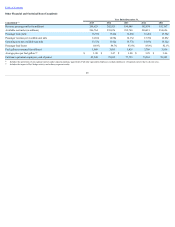
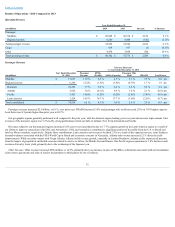
Passenger Revenue
Increase(Decrease)
vs.YearEndedDecember31,2013
(inmillions)
YearEndedDecember
31,2014
Passenger
Revenue
RPMs
(Traffic) ASMs(Capacity)
PassengerMile
Yield PRASM LoadFactor
Mainline $ 17,017 11.9% 6.5% 4.1% 5.1% 7.5% 2.0 pts
Regionalcarriers 6,266 (2.2)% (1.5)% (3.8)% (0.7)% 1.7% 1.9 pts
Domestic 23,283 7.7% 5.0% 2.4% 2.6% 5.2% 2.4 pts
Atlantic 5,826 3.0% (0.1)% 0.9% 3.0% 2.1% (0.8) pts
Pacific 3,421 (4.0)% (1.2)% (0.2)% (2.8)% (3.8)% (0.9) pts
LatinAmerica 2,424 14.8% 16.7% 17.7% (1.6)% (2.5)% (0.7) pts
Totalconsolidated $ 34,954 6.1% 4.1% 3.0% 2.0% 3.0% 0.9 pts
Passengerrevenueincreased$2.0billion,or6.1%,overprioryear.PRASMincreased3.0%andpassengermileyieldincreased2.0%on3.0%highercapacity.
Loadfactorwas0.9pointshigherthanprioryearat84.7%.
Ourgeographicregionsgenerallyperformedwellcomparedtotheprioryear,withthedomesticregionleadingyear-over-yearunitrevenueimprovement.Unit
revenuesofthedomesticregionrose5.2%ledbystrongperformancesfromourhubsinAtlanta,NewYork-LaGuardiaandSeattle.
Revenuesrelatedtoourinternationalregionsincreased3.0%year-over-yearprimarilydueto17.7%capacitygrowthintheLatinAmericaregionasaresultof
oureffortstoimproveconnectionswithGOLandAeroméxico.GOLandAeroméxicocontributedasignificantportionofthetrafficfromtheU.S.toBraziland
intokeyMexicomarkets,respectively.Despitethesecontributions,LatinAmericaunitrevenuesdeclined2.5%asaresultofthecapacityincrease,somebusiness
demandweaknessassociatedwiththeFIFAWorldCupinBrazilandeconomicconcernsinVenezuela.Atlanticunitrevenueincreased2.1%drivenbyyield
improvements.WhileourjointventurewithVirginAtlanticreflectedsolidrevenuegrowth,especiallyinLondon-Heathrow,Atlanticyieldsexperiencedpressure
fromtheimpactofgeopoliticalandhealthconcernsrelatedtoservicetoAfrica,theMiddleEastandRussia.OurPacificregionexperienceda3.8%declineinunit
revenuesdrivenbyloweryield,primarilyduetotheweakeningoftheJapaneseyen.
OtherRevenue.Otherrevenueincreased$580million,or14.9%,primarilyduetoanincreaseinsalesofSkyMiles,settlementsassociatedwithourtransatlantic
jointventureagreementsandsalesofnon-jetfuelproductstothirdpartiesbyouroilrefinery.
32