Delta Airlines 2015 Annual Report Download - page 29
Download and view the complete annual report
Please find page 29 of the 2015 Delta Airlines annual report below. You can navigate through the pages in the report by either clicking on the pages listed below, or by using the keyword search tool below to find specific information within the annual report.-
 1
1 -
2
-
3
-
4
-
5
-
6
-
7
-
8
-
9
-
10
-
11
-
12
-
13
-
14
-
15
-
16
-
17
-
18
-
 19
19 -
 20
20 -
 21
21 -
 22
22 -
 23
23 -
 24
24 -
 25
25 -
 26
26 -
 27
27 -
 28
28 -
 29
29 -
 30
30 -
 31
31 -
 32
32 -
 33
33 -
 34
34 -
 35
35 -
 36
36 -
 37
37 -
 38
38 -
 39
39 -
40
-
41
-
42
-
43
-
44
-
45
-
46
-
47
-
48
-
49
-
50
-
51
-
52
-
53
-
54
-
55
-
56
-
57
-
58
-
59
-
60
-
61
-
62
-
63
-
64
-
65
-
66
-
67
-
68
-
69
-
70
-
71
-
72
-
73
-
74
-
75
-
76
-
77
-
78
-
79
-
80
-
81
-
82
-
83
-
84
-
85
-
86
-
87
-
88
-
89
-
90
-
91
-
92
-
93
-
94
-
95
-
96
-
97
-
98
-
99
-
100
-
101
-
102
-
103
-
104
-
105
-
106
-
107
-
108
-
109
-
110
-
111
-
112
-
113
-
114
-
115
-
116
-
117
-
118
-
119
-
120
-
121
-
122
-
123
-
124
-
125
-
126
-
127
-
128
-
129
-
130
-
131
-
132
-
133
-
134
-
135
-
136
-
137
-
138
-
139
-
140
-
141
-
142
-
143
-
144
-
145
-
146
-
147
-
148
-
149
-
150
-
151
-
152
-
153
-
154
-
155
-
156
-
157
-
158
-
159
-
160
-
161
-
162
-
163
-
164
-
165
-
166
-
167
-
168
-
169
-
170
-
171
-
172
-
173
-
174
-
175
-
176
-
177
-
178
-
179
-
180
-
181
-
182
-
183
-
184
-
185
-
186
-
187
-
188
-
189
-
190
-
191
 |
 |

TableofContents
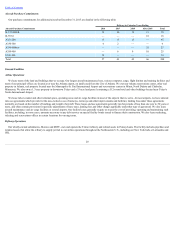
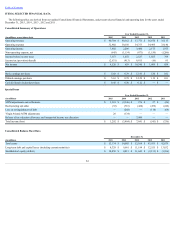
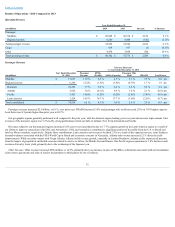
OtherFinancialandStatisticalData(Unaudited)
YearEndedDecember31,
Consolidated(1) 2015 2014 2013 2012 2011
Revenuepassengermiles(inmillions) 209,625 202,925 194,988 192,974 192,767
Availableseatmiles(inmillions) 246,764 239,676 232,740 230,415 234,656
Passengermileyield 16.59¢ 17.22¢ 16.89¢ 16.46¢ 15.70¢
Passengerrevenueperavailableseatmile 14.10¢ 14.58¢ 14.15¢ 13.78¢ 12.89¢
Operatingcostperavailableseatmile 13.33¢ 15.92¢ 14.77¢ 14.97¢ 14.12¢
Passengerloadfactor 84.9% 84.7% 83.8% 83.8% 82.1%
Fuelgallonsconsumed(inmillions) 3,988 3,893 3,828 3,769 3,856
Averagepriceperfuelgallon(2) $ 1.90 $ 3.47 $ 3.00 $ 3.25 $ 3.06
Full-timeequivalentemployees,endofperiod 82,949 79,655 77,755 73,561 78,392
(1) Includestheoperationsofourregionalcarriersundercapacitypurchaseagreements.Full-timeequivalentemployeesexcludeemployeesofregionalcarriersthatwedonotown.
(2) Includestheimpactoffuelhedgeactivityandrefinerysegmentresults.
25