Delta Airlines 2015 Annual Report Download - page 30
Download and view the complete annual report
Please find page 30 of the 2015 Delta Airlines annual report below. You can navigate through the pages in the report by either clicking on the pages listed below, or by using the keyword search tool below to find specific information within the annual report.-
 1
1 -
2
-
3
-
4
-
5
-
6
-
7
-
8
-
9
-
10
-
11
-
12
-
13
-
14
-
15
-
16
-
17
-
18
-
19
-
 20
20 -
 21
21 -
 22
22 -
 23
23 -
 24
24 -
 25
25 -
 26
26 -
 27
27 -
 28
28 -
 29
29 -
 30
30 -
 31
31 -
 32
32 -
 33
33 -
 34
34 -
 35
35 -
 36
36 -
 37
37 -
 38
38 -
 39
39 -
 40
40 -
41
-
42
-
43
-
44
-
45
-
46
-
47
-
48
-
49
-
50
-
51
-
52
-
53
-
54
-
55
-
56
-
57
-
58
-
59
-
60
-
61
-
62
-
63
-
64
-
65
-
66
-
67
-
68
-
69
-
70
-
71
-
72
-
73
-
74
-
75
-
76
-
77
-
78
-
79
-
80
-
81
-
82
-
83
-
84
-
85
-
86
-
87
-
88
-
89
-
90
-
91
-
92
-
93
-
94
-
95
-
96
-
97
-
98
-
99
-
100
-
101
-
102
-
103
-
104
-
105
-
106
-
107
-
108
-
109
-
110
-
111
-
112
-
113
-
114
-
115
-
116
-
117
-
118
-
119
-
120
-
121
-
122
-
123
-
124
-
125
-
126
-
127
-
128
-
129
-
130
-
131
-
132
-
133
-
134
-
135
-
136
-
137
-
138
-
139
-
140
-
141
-
142
-
143
-
144
-
145
-
146
-
147
-
148
-
149
-
150
-
151
-
152
-
153
-
154
-
155
-
156
-
157
-
158
-
159
-
160
-
161
-
162
-
163
-
164
-
165
-
166
-
167
-
168
-
169
-
170
-
171
-
172
-
173
-
174
-
175
-
176
-
177
-
178
-
179
-
180
-
181
-
182
-
183
-
184
-
185
-
186
-
187
-
188
-
189
-
190
-
191
 |
 |

TableofContents
ITEM7.MANAGEMENT'SDISCUSSIONANDANALYSISOFFINANCIALCONDITIONANDRESULTSOFOPERATIONS
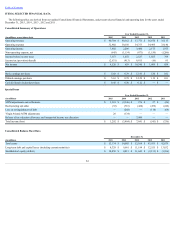
FinancialHighlights-2015Comparedto2014
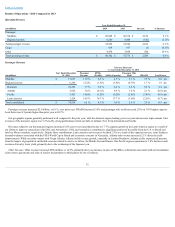
Ourpre-taxincomefor2015was$7.2billion,representinga$6.1billionincreasecomparedtotheprioryearpredominantlyasaresultoflowerfuelpricesand
strongnon-fuelcostcontrols.Pre-taxincome,adjustedforspecialitems(anon-GAAPfinancialmeasure)increased$1.3billion,or29.3%,to$5.9billion.Special
itemsin2015wereprimarilyrelatedtofuelhedgeMTMadjustmentsandsettlements,whichtotaled$1.3billion.
Revenue.Ouroperatingrevenueincreased$342millioncomparedtotheprioryearprimarilyresultingfromourBrandedFaresinitiativeandouragreementwith
AmericanExpress.Passengerrevenueperavailableseatmile("PRASM")decreased3.3%on3.0%highercapacity.ThedecreaseinPRASMwaslargelydrivenby
competitivepressureinthecurrentlowfuelpriceenvironmentandtheimpactofU.S.dollarstrengthonticketssoldininternationalmarkets,whichare
predominantlypricedinlocalcurrency.
OperatingExpense.Totaloperatingexpensedecreased$5.3billionfrom2014drivenbylowerfuelprices,partiallyoffsetbyfuelhedgelosses,highersalaries
andrelatedcostsandprofitsharing.During2015,Brentcrudeoilaveraged$52perbarrelandclosedtheyearbelow$40perbarrel,whichissignificantlylower
thantheaverageof$99perbarrelduring2014.Salariesandrelatedcostswerehigherasaresultofincreasesinpilotandflightattendantblockhoursduetohigher
capacityandpayrateincreasesimplementedin2015.
Ourconsolidatedoperatingcostperavailableseatmile("CASM")for2015decreased16.3%to13.33centsfrom15.92centsin2014,ona3.0%increasein
capacity,primarilyduetolowerfuelprices.Non-fuelunitcosts("CASM-Ex,"anon-GAAPfinancialmeasure)wereflatin2015comparedto2014at9.17cents
duetostrongnon-fuelcostcontrolsandthestrengthoftheU.S.dollar.Our2015unitcostperformancewasin-linewithourgoaloflimitingnon-fuelunitcost
growthtobelow2%annually.
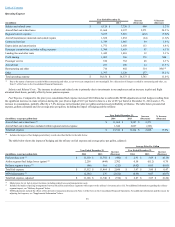
Thenon-GAAPfinancialmeasuresforpre-taxincome,adjustedforspecialitemsandCASM-Exusedinthissectionandreturnoninvestedcapital("ROIC")
andadjustednetdebt,usedinthesectionbelow,aredefinedandreconciledin"SupplementalInformation"below.
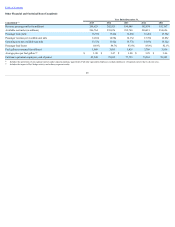
CompanyInitiatives
Runningareliable,customer-focusedairlinehasproducedahigherROIC(anon-GAAPfinancialmeasure),whichincreasedfrom20.7%in2014to28.3%in
2015.Thisimprovedfinancialperformancehasallowedustoimproveourbalancesheetbyreducingadjustednetdebt(anon-GAAPfinancialmeasure)to$6.7
billion,increasefundingofourdefinedbenefitpensionplansandincreasetheamountofcapitalreturnedtoourshareholders.Wearefocusedondelivering
additionalvalueforshareholdersinthefuturethroughrevenuegrowth,costproductivityandprudentdeploymentofcashflows.
Driving Revenue Growth
OperationalReliability
Akeydriverofourrevenuegrowthishighercustomersatisfactionresultingfromstrongoperationalreliability.Wehavesignificantlyinvestedinourbusiness
since2010toimproveouroperationalperformance,whichconsistentlyranksfirstamongthemajorU.S.carriers.During2015,weoperated161dayswithzero
mainlinecanceledflights,a69%improvementoverour2014performance.Inaddition,ourreportedcompletionfactorof99.6%andon-timearrivalrateof85.9%
placesusatthetopamongthemajorglobalU.S.carriers.Thisoperationalexcellenceresultedinafourpointincreaseinourdomesticnetpromoterscorecompared
to2014.Accordingly,ourcorporateticketvolumeincreased4%in2015,reflectingourreliableserviceandhigh-qualityproduct.
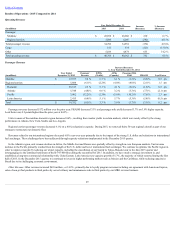
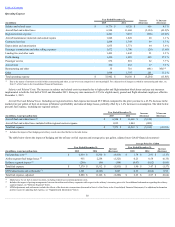
GlobalStrategy
Weareexpandingourglobalnetwork.Underthisstrategy,wearestrengtheningourpresenceinmajoranddevelopingmarketsaroundtheworldinaneffortto
increaseanddiversifyournetworkintohighrevenueandhighgrowthmarkets.Thegrowthofourglobalpresencewillenablecustomerstoseamlesslyconnectto
moreplaceswhileenjoyingaconsistent,high-qualitytravelexperience.WearedeployingthisstrategythroughinvestmentsinEurope,AsiaandLatinAmerica.
26