Delta Airlines 2015 Annual Report Download - page 64
Download and view the complete annual report
Please find page 64 of the 2015 Delta Airlines annual report below. You can navigate through the pages in the report by either clicking on the pages listed below, or by using the keyword search tool below to find specific information within the annual report.-
 1
1 -
2
-
3
-
4
-
5
-
6
-
7
-
8
-
9
-
10
-
11
-
12
-
13
-
14
-
15
-
16
-
17
-
18
-
19
-
20
-
21
-
22
-
23
-
24
-
25
-
26
-
27
-
28
-
29
-
30
-
31
-
32
-
33
-
34
-
35
-
36
-
37
-
38
-
39
-
40
-
41
-
42
-
43
-
44
-
45
-
46
-
47
-
48
-
49
-
50
-
51
-
52
-
53
-
 54
54 -
 55
55 -
 56
56 -
 57
57 -
 58
58 -
 59
59 -
 60
60 -
 61
61 -
 62
62 -
 63
63 -
 64
64 -
 65
65 -
 66
66 -
 67
67 -
 68
68 -
 69
69 -
 70
70 -
 71
71 -
 72
72 -
 73
73 -
 74
74 -
75
-
76
-
77
-
78
-
79
-
80
-
81
-
82
-
83
-
84
-
85
-
86
-
87
-
88
-
89
-
90
-
91
-
92
-
93
-
94
-
95
-
96
-
97
-
98
-
99
-
100
-
101
-
102
-
103
-
104
-
105
-
106
-
107
-
108
-
109
-
110
-
111
-
112
-
113
-
114
-
115
-
116
-
117
-
118
-
119
-
120
-
121
-
122
-
123
-
124
-
125
-
126
-
127
-
128
-
129
-
130
-
131
-
132
-
133
-
134
-
135
-
136
-
137
-
138
-
139
-
140
-
141
-
142
-
143
-
144
-
145
-
146
-
147
-
148
-
149
-
150
-
151
-
152
-
153
-
154
-
155
-
156
-
157
-
158
-
159
-
160
-
161
-
162
-
163
-
164
-
165
-
166
-
167
-
168
-
169
-
170
-
171
-
172
-
173
-
174
-
175
-
176
-
177
-
178
-
179
-
180
-
181
-
182
-
183
-
184
-
185
-
186
-
187
-
188
-
189
-
190
-
191
 |
 |

TableofContents
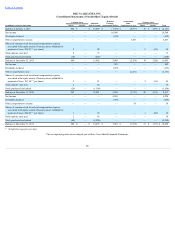
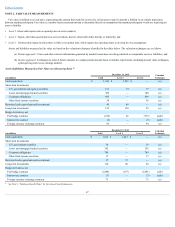
DELTAAIRLINES,INC.
ConsolidatedStatementsofStockholders'Equity(Deficit)
CommonStock Additional
Paid-InCapital
Retained
Earnings
(AccumulatedDeficit)
Accumulated
Other
ComprehensiveLoss
TreasuryStock
(inmillions,exceptpersharedata) Shares Amount Shares Amount Total
BalanceatJanuary1,2013 868 $ — $ 14,069 $ (7,389) $ (8,577) 16 $ (234) $ (2,131)
Netincome — — — 10,540 — — — 10,540
Dividendsdeclared — — — (102) — — — (102)
Othercomprehensiveincome — — — — 3,447 — — 3,447
Sharesofcommonstockissuedandcompensationexpense
associatedwithequityawards(Treasuryshareswithheldfor
paymentoftaxes,$14.97(1)pershare) 5 — 90 — — 2 (24) 66
Stockoptionsexercised 6 — 73 — — — — 73
Stockpurchasedandretired (10) — (250) — — — — (250)
BalanceatDecember31,2013 869 — 13,982 3,049 (5,130) 18 (258) 11,643
Netincome — — — 659 — — — 659
Dividendsdeclared — — — (252) — — — (252)
Othercomprehensiveloss — — — — (2,181) — — (2,181)
Sharesofcommonstockissuedandcompensationexpense
associatedwithequityawards(Treasuryshareswithheldfor
paymentoftaxes,$31.46(1)pershare) 3 — 81 — — 2 (55) 26
Stockoptionsexercised 2 — 18 — — — — 18
Stockpurchasedandretired (29) — (1,100) — — — — (1,100)
BalanceatDecember31,2014 845 — 12,981 3,456 (7,311) 20 (313) 8,813
Netincome — — — 4,526 — — — 4,526
Dividendsdeclared — — — (359) — — — (359)
Othercomprehensiveincome — — — — 36 — — 36
Sharesofcommonstockissuedandcompensationexpense
associatedwithequityawards(Treasuryshareswithheldfor
paymentoftaxes,$46.83(1)pershare) 1 — 76 — — 1 (60) 16
Stockoptionsexercised 2 — 18 — — — — 18
Stockpurchasedandretired (48) — (2,200) — — — — (2,200)
BalanceatDecember31,2015 800 $ — $ 10,875 $ 7,623 $ (7,275) 21 $ (373) $ 10,850
(1) Weightedaveragepricepershare
TheaccompanyingnotesareanintegralpartoftheseConsolidatedFinancialStatements.
58