Delta Airlines 2015 Annual Report Download - page 37
Download and view the complete annual report
Please find page 37 of the 2015 Delta Airlines annual report below. You can navigate through the pages in the report by either clicking on the pages listed below, or by using the keyword search tool below to find specific information within the annual report.-
 1
1 -
2
-
3
-
4
-
5
-
6
-
7
-
8
-
9
-
10
-
11
-
12
-
13
-
14
-
15
-
16
-
17
-
18
-
19
-
20
-
21
-
22
-
23
-
24
-
25
-
26
-
 27
27 -
 28
28 -
 29
29 -
 30
30 -
 31
31 -
 32
32 -
 33
33 -
 34
34 -
 35
35 -
 36
36 -
 37
37 -
 38
38 -
 39
39 -
 40
40 -
 41
41 -
 42
42 -
 43
43 -
 44
44 -
 45
45 -
 46
46 -
 47
47 -
48
-
49
-
50
-
51
-
52
-
53
-
54
-
55
-
56
-
57
-
58
-
59
-
60
-
61
-
62
-
63
-
64
-
65
-
66
-
67
-
68
-
69
-
70
-
71
-
72
-
73
-
74
-
75
-
76
-
77
-
78
-
79
-
80
-
81
-
82
-
83
-
84
-
85
-
86
-
87
-
88
-
89
-
90
-
91
-
92
-
93
-
94
-
95
-
96
-
97
-
98
-
99
-
100
-
101
-
102
-
103
-
104
-
105
-
106
-
107
-
108
-
109
-
110
-
111
-
112
-
113
-
114
-
115
-
116
-
117
-
118
-
119
-
120
-
121
-
122
-
123
-
124
-
125
-
126
-
127
-
128
-
129
-
130
-
131
-
132
-
133
-
134
-
135
-
136
-
137
-
138
-
139
-
140
-
141
-
142
-
143
-
144
-
145
-
146
-
147
-
148
-
149
-
150
-
151
-
152
-
153
-
154
-
155
-
156
-
157
-
158
-
159
-
160
-
161
-
162
-
163
-
164
-
165
-
166
-
167
-
168
-
169
-
170
-
171
-
172
-
173
-
174
-
175
-
176
-
177
-
178
-
179
-
180
-
181
-
182
-
183
-
184
-
185
-
186
-
187
-
188
-
189
-
190
-
191
 |
 |

TableofContents
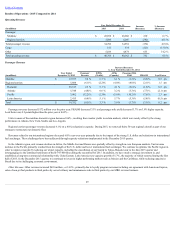
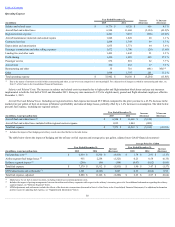
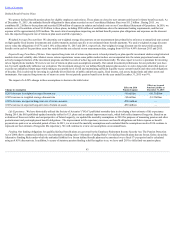
Operating Expense
YearEndedDecember31, Increase
(Decrease)
%Increase
(Decrease)(inmillions) 2014 2013
Salariesandrelatedcosts $ 8,120 $ 7,720 $ 400 5.2%
Aircraftfuelandrelatedtaxes 11,668 9,397 2,271 24.2%
Regionalcarriersexpense 5,237 5,669 (432) (7.6)%
Aircraftmaintenancematerialsandoutsiderepairs 1,828 1,852 (24) (1.3)%
Contractedservices 1,749 1,665 84 5.0%
Depreciationandamortization 1,771 1,658 113 6.8%
Passengercommissionsandothersellingexpenses 1,700 1,603 97 6.1%
Landingfeesandotherrents 1,442 1,410 32 2.3%
Profitsharing 1,085 506 579 NM
Passengerservice 810 762 48 6.3%
Aircraftrent 233 209 24 11.5%
Restructuringandother 716 402 314 NM(1)
Other 1,797 1,520 277 18.2%
Totaloperatingexpense $ 38,156 $ 34,373 $ 3,783 11.0%
(1) Duetothenatureofamountsrecordedwithinrestructuringandother,ayear-over-yearcomparisonisnotmeaningful.Foradiscussionofchargesrecordedinrestructuringandother,see
Note15oftheNotestotheConsolidatedFinancialStatements.
SalariesandRelatedCosts.Theincreaseinsalariesandrelatedcostsisprimarilyduetoinvestmentsinouremployeesandanincreaseinpilotandflight
attendantblockhours,partiallyoffsetbylowerpensionexpense.
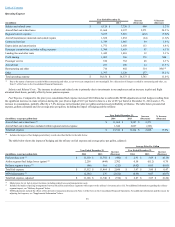
FuelExpense.Comparedtotheprioryear,consolidatedfuelexpenseincreased$2.0billionduetounfavorableMTMadjustmentsonfuelhedgesresultingfrom
thesignificantdecreaseincrudeoilpricesduringtheyear(fromahighof$115perbarrelinJunetoalowof$57perbarrelatDecember31,2014)anda1.7%
increaseinconsumption,partiallyoffsetbya7.8%decreaseinfuelmarketpricepergallonandincreasedprofitabilityatMonroe.Thetablebelowpresentsfuel
expense,gallonsconsumedandouraveragepricepergallon,includingtheimpactofhedgingandtherefinery:
YearEndedDecember31, Increase
(Decrease)
%Increase
(Decrease)(inmillions,exceptpergallondata) 2014 2013
Aircraftfuelandrelatedtaxes(1) $ 11,668 $ 9,397 $ 2,271
Aircraftfuelandrelatedtaxesincludedwithinregionalcarriersexpense 1,844 2,067 (223)
Totalfuelexpense $ 13,512 $ 11,464 $ 2,048 17.9%
(1) Includestheimpactoffuelhedgingandrefineryresultsdescribedfurtherinthetablebelow.
Thetablebelowshowstheimpactofhedgingandtherefineryonfuelexpenseandaveragepricepergallon,adjusted:
AveragePricePerGallon
YearEndedDecember31, Increase
(Decrease)
YearEndedDecember31, Increase
(Decrease)(inmillions,exceptpergallondata) 2014 2013
2014 2013
Fuelpurchasecost(1) $ 11,350 $ 11,792 $ (442)
$ 2.91 $ 3.09 $ (0.18)
Airlinesegmentfuelhedgelosses(gains)(2) 2,258 (444) 2,702
0.58 (0.12) 0.70
Refinerysegmentimpact(2) (96) 116 (212)
(0.02) 0.03 (0.05)
Totalfuelexpense $ 13,512 $ 11,464 $ 2,048
$ 3.47 $ 3.00 $ 0.47
MTMadjustments(3) (2,346) 276 (2,622)
(0.60) 0.07 (0.67)
Totalfuelexpense,adjusted $ 11,166 $ 11,740 $ (574)
$ 2.87 $ 3.07 $ (0.20)
(1) Marketpriceforjetfuelatairportlocations,includingrelatedtaxesandtransportationcosts.
(2) Includestheimpactofpricingarrangementsbetweentheairlineandrefinerysegmentswithrespecttotherefinery'sinventorypricerisk.Foradditionalinformationregardingtherefinery
segmentimpact,see"RefinerySegment"below.
(3) MTMadjustmentsincludetheeffectsofthederivativetransactionsdiscussedinNote4oftheNotestotheConsolidatedFinancialStatements.Foradditionalinformationandthereasonfor
adjustingfuelexpense,see"SupplementalInformation"below.
33