DIRECTV 2010 Annual Report Download - page 84
Download and view the complete annual report
Please find page 84 of the 2010 DIRECTV annual report below. You can navigate through the pages in the report by either clicking on the pages listed below, or by using the keyword search tool below to find specific information within the annual report.-
 1
1 -
2
-
3
-
4
-
5
-
6
-
7
-
8
-
9
-
10
-
11
-
12
-
13
-
14
-
15
-
16
-
17
-
18
-
19
-
20
-
21
-
22
-
23
-
24
-
25
-
26
-
27
-
28
-
29
-
30
-
31
-
32
-
33
-
34
-
35
-
36
-
37
-
38
-
39
-
40
-
41
-
42
-
43
-
44
-
45
-
46
-
47
-
48
-
49
-
50
-
51
-
52
-
53
-
54
-
55
-
56
-
57
-
58
-
59
-
60
-
61
-
62
-
63
-
64
-
65
-
66
-
67
-
68
-
69
-
70
-
71
-
72
-
73
-
 74
74 -
 75
75 -
 76
76 -
 77
77 -
 78
78 -
 79
79 -
 80
80 -
 81
81 -
 82
82 -
 83
83 -
 84
84 -
 85
85 -
 86
86 -
 87
87 -
 88
88 -
 89
89 -
 90
90 -
 91
91 -
 92
92 -
 93
93 -
 94
94 -
95
-
96
-
97
-
98
-
99
-
100
-
101
-
102
-
103
-
104
-
105
-
106
-
107
-
108
-
109
-
110
-
111
-
112
-
113
-
114
-
115
-
116
-
117
-
118
-
119
-
120
-
121
-
122
-
123
-
124
-
125
-
126
-
127
-
128
-
129
-
130
-
131
-
132
-
133
-
134
-
135
-
136
-
137
-
138
-
139
-
140
-
141
-
142
 |
 |

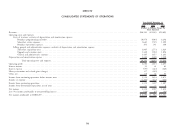
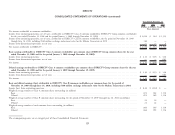
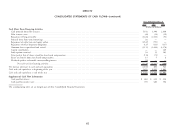
DIRECTV
CONSOLIDATED STATEMENTS OF CASH FLOWS—(continued)
Years Ended December 31,
2010 2009 2008
(Dollars in Millions)
Cash Flows From Financing Activities
Cash proceeds from debt issuance .......................................................................... 5,978 1,990 2,490
Debt issuance costs ................................................................................... (44) (14) (19)
Repayment of long-term debt ............................................................................. (2,323) (1,018) (53)
Proceeds from short-term borrowings ........................................................................ 38 — —
Repayment of collar loan and equity collars .................................................................... (1,537) (751) —
Repayment of other long-term obligations ..................................................................... (127) (116) (117)
Common shares repurchased and retired ...................................................................... (5,111) (1,696) (3,174)
Capital contribution ................................................................................... — — 160
Stock options exercised ................................................................................. 38 35 105
Taxes paid in lieu of shares issued for share-based compensation ....................................................... (118) (72) —
Excess tax benefit from share-based compensation ................................................................ 11 5 8
Dividends paid to redeemable noncontrolling interest ............................................................. (15) — —
Net cash used in financing activities .................................................................... (3,210) (1,637) (600)
Net increase (decrease) in cash and cash equivalents ................................................................ (1,103) 600 922
Cash and cash equivalents at beginning of the year ................................................................. 2,605 2,005 1,083
Cash and cash equivalents at end of the year .................................................................... $1,502 $ 2,605 $ 2,005
Supplemental Cash Flow Information
Cash paid for interest .................................................................................. $ 460 $ 412 $ 334
Cash paid for income taxes .............................................................................. 705 484 706
The accompanying notes are an integral part of these Consolidated Financial Statements.
62