DIRECTV 2010 Annual Report Download - page 52
Download and view the complete annual report
Please find page 52 of the 2010 DIRECTV annual report below. You can navigate through the pages in the report by either clicking on the pages listed below, or by using the keyword search tool below to find specific information within the annual report.-
 1
1 -
2
-
3
-
4
-
5
-
6
-
7
-
8
-
9
-
10
-
11
-
12
-
13
-
14
-
15
-
16
-
17
-
18
-
19
-
20
-
21
-
22
-
23
-
24
-
25
-
26
-
27
-
28
-
29
-
30
-
31
-
32
-
33
-
34
-
35
-
36
-
37
-
38
-
39
-
40
-
41
-
 42
42 -
 43
43 -
 44
44 -
 45
45 -
 46
46 -
 47
47 -
 48
48 -
 49
49 -
 50
50 -
 51
51 -
 52
52 -
 53
53 -
 54
54 -
 55
55 -
 56
56 -
 57
57 -
 58
58 -
 59
59 -
 60
60 -
 61
61 -
 62
62 -
63
-
64
-
65
-
66
-
67
-
68
-
69
-
70
-
71
-
72
-
73
-
74
-
75
-
76
-
77
-
78
-
79
-
80
-
81
-
82
-
83
-
84
-
85
-
86
-
87
-
88
-
89
-
90
-
91
-
92
-
93
-
94
-
95
-
96
-
97
-
98
-
99
-
100
-
101
-
102
-
103
-
104
-
105
-
106
-
107
-
108
-
109
-
110
-
111
-
112
-
113
-
114
-
115
-
116
-
117
-
118
-
119
-
120
-
121
-
122
-
123
-
124
-
125
-
126
-
127
-
128
-
129
-
130
-
131
-
132
-
133
-
134
-
135
-
136
-
137
-
138
-
139
-
140
-
141
-
142
 |
 |

DIRECTV
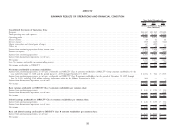
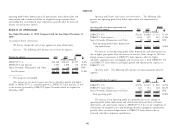
ITEM 6. SELECTED FINANCIAL DATA
Years Ended and As of December 31,
2010 2009 2008 2007 2006
(Dollars in Millions, Except Per Share Amounts)
Consolidated Statements of Operations Data:
Revenues ............................................................................ $24,102 $21,565 $19,693 $17,246 $14,755
Total operating costs and expenses ............................................................ 20,206 18,892 16,998 14,760 12,398
Operating profit ....................................................................... $ 3,896 $ 2,673 $ 2,695 $ 2,486 $ 2,357
Income from continuing operations attributable to DIRECTV .......................................... $ 2,198 $ 942 $ 1,515 $ 1,434 $ 1,420
Basic earnings attributable to DIRECTV Class A common stockholders per common share (DIRECTV Group common
stockholders for the period January 1, 2009 through November 19, 2009 and the years ended December 31, 2008, 2007
and 2006):
Income from continuing operations ........................................................... $ 2.31 $ 0.96 $ 1.36 $ 1.20 $ 1.13
Diluted earnings attributable to DIRECTV Class A common stockholders per common share (DIRECTV Group
common stockholders for the period January 1, 2009 through November 19, 2009 and the years ended
December 31, 2008, 2007 and 2006):
Income from continuing operations ........................................................... $ 2.30 $ 0.95 $ 1.36 $ 1.20 $ 1.12
Basic and diluted earnings (loss) attributable to DIRECTV Class B common stockholders per common share:
Income (loss) from continuing operations, net of taxes ............................................... $ 8.44 $ (0.02) $ — $ — $ —
Weighted average number of Class A common shares outstanding (in millions)
Basic ............................................................................. 870 982 1,110 1,195 1,262
Diluted ........................................................................... 876 989 1,114 1,202 1,270
Weighted average number of Class B common shares outstanding, for the period of November 19, 2009 through
June 16, 2010 (in millions)
Basic ............................................................................. 22 22———
Diluted ........................................................................... 22 22———
Weighted average number of total common shares outstanding (in millions):
Basic ............................................................................. 880 985 1,110 1,195 1,262
Diluted ........................................................................... 886 992 1,114 1,202 1,270
2010 2009 2008 2007 2006
Consolidated Balance Sheet Data:
Total assets ........................................................................... $17,909 $18,260 $16,539 $15,063 $15,141
Obligations under capital leases .............................................................. 580 586 584 57 91
Long-term debt ........................................................................ 10,472 6,500 5,725 3,347 3,395
Total stockholders’ equity (deficit) ............................................................ (194) 2,911 4,631 6,013 6,473
See the Notes to the Consolidated Financial Statements and Management’s Discussion and Analysis of Financial Condition and Results of Operations for additional
information regarding significant transactions during each of the three years in the period ended December 31, 2010.
***
30