DIRECTV 2010 Annual Report Download - page 67
Download and view the complete annual report
Please find page 67 of the 2010 DIRECTV annual report below. You can navigate through the pages in the report by either clicking on the pages listed below, or by using the keyword search tool below to find specific information within the annual report.-
 1
1 -
2
-
3
-
4
-
5
-
6
-
7
-
8
-
9
-
10
-
11
-
12
-
13
-
14
-
15
-
16
-
17
-
18
-
19
-
20
-
21
-
22
-
23
-
24
-
25
-
26
-
27
-
28
-
29
-
30
-
31
-
32
-
33
-
34
-
35
-
36
-
37
-
38
-
39
-
40
-
41
-
42
-
43
-
44
-
45
-
46
-
47
-
48
-
49
-
50
-
51
-
52
-
53
-
54
-
55
-
56
-
 57
57 -
 58
58 -
 59
59 -
 60
60 -
 61
61 -
 62
62 -
 63
63 -
 64
64 -
 65
65 -
 66
66 -
 67
67 -
 68
68 -
 69
69 -
 70
70 -
 71
71 -
 72
72 -
 73
73 -
 74
74 -
 75
75 -
 76
76 -
 77
77 -
78
-
79
-
80
-
81
-
82
-
83
-
84
-
85
-
86
-
87
-
88
-
89
-
90
-
91
-
92
-
93
-
94
-
95
-
96
-
97
-
98
-
99
-
100
-
101
-
102
-
103
-
104
-
105
-
106
-
107
-
108
-
109
-
110
-
111
-
112
-
113
-
114
-
115
-
116
-
117
-
118
-
119
-
120
-
121
-
122
-
123
-
124
-
125
-
126
-
127
-
128
-
129
-
130
-
131
-
132
-
133
-
134
-
135
-
136
-
137
-
138
-
139
-
140
-
141
-
142
 |
 |

DIRECTV
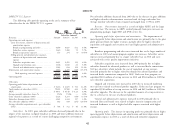
Noncontrolling interests in net earnings of subsidiaries. We recognized DIRECTV U.S. Segment
noncontrolling interest in net earnings of subsidiaries of $65 million in 2009 and The following table provides operating results and a summary of key
$92 million in 2008 at Sky Brazil. Noncontrolling interest in net earnings of subscriber data for the DIRECTV U.S. segment:
subsidiaries in 2009 decreased due to lower net income at Sky Brazil.
Change
Earnings Per Share. Class A common stock earnings per share (DIRECTV 2009 2008 $ %
Group common stock for the period January 1, 2008 through November 19, 2009) (Dollars in Millions, Except Per
and weighted shares outstanding were as follows for the years ended December 31: Subscriber Amounts)
Revenues ........................... $18,671 $17,310 $1,361 7.9%
2009 2008 Operating costs and expenses
(Shares in Costs of revenues, exclusive of depreciation and
Millions) amortization expense
Basic earnings attributable to DIRECTV Class A common Broadcast programming and other ........ 8,027 7,424 603 8.1%
stockholders per common share ..................... $0.96 $ 1.37 Subscriber service expenses ............. 1,268 1,139 129 11.3%
Diluted earnings attributable to DIRECTV Class A common Broadcast operations expenses ........... 274 265 9 3.4%
stockholders per common share ..................... 0.95 1.37 Selling, general and administrative expenses,
Weighted average number of Class A common shares outstanding exclusive of depreciation and amortization
Basic ........................................ 982 1,110 expense
Subscriber acquisition costs ............. 2,478 2,191 287 13.1%
Diluted ...................................... 989 1,114
Upgrade and retention costs ............ 1,045 1,027 18 1.8%
The decreases in basic and diluted earnings per share for Class A common General and administrative expenses . . . . . . . 894 873 21 2.4%
stock were due to lower net income attributable to DIRECTV, which was primarily Depreciation and amortization expense ......... 2,275 2,061 214 10.4%
due to the charge recorded for the Liberty Transaction in 2009, partially offset by Total operating costs and expenses ....... 16,261 14,980 1,281 8.6%
the reduction in weighted shares outstanding resulting from our share repurchase Operating profit ....................... $2,410 $ 2,330 $ 80 3.4%
program and the effect of the Liberty Transaction.
Other data:
Operating profit before depreciation and
amortization ....................... $4,685 $ 4,391 $ 294 6.7%
Total number of subscribers (000’s) (1) ........ 18,560 17,621 939 5.3%
ARPU ............................. $85.48 $ 83.90 $ 1.58 1.9%
Average monthly subscriber churn % .......... 1.53% 1.47% — 4.1%
Gross subscriber additions (000’s) ............ 4,273 3,904 369 9.5%
Subscriber disconnections (000’s) ............ 3,334 3,043 291 9.6%
Net subscriber additions (000’s) ............. 939 861 78 9.1%
Average subscriber acquisition costs—per subscriber
(SAC) ........................... $ 712 $ 715 $ (3) (0.4)%
(1) As discussed above in ‘‘Key Terminology,’’ during 2008, we had a one-time downward
adjustment to our subscriber count of approximately 71,000 subscribers related to
commercial equivalent viewing units. This adjustment did not affect our revenue,
45